|

NZD/USD Price Analysis: Pair trades higher in recovery as buyers attempt to take control

  • NZD/USD gained further ground around 0.5900.
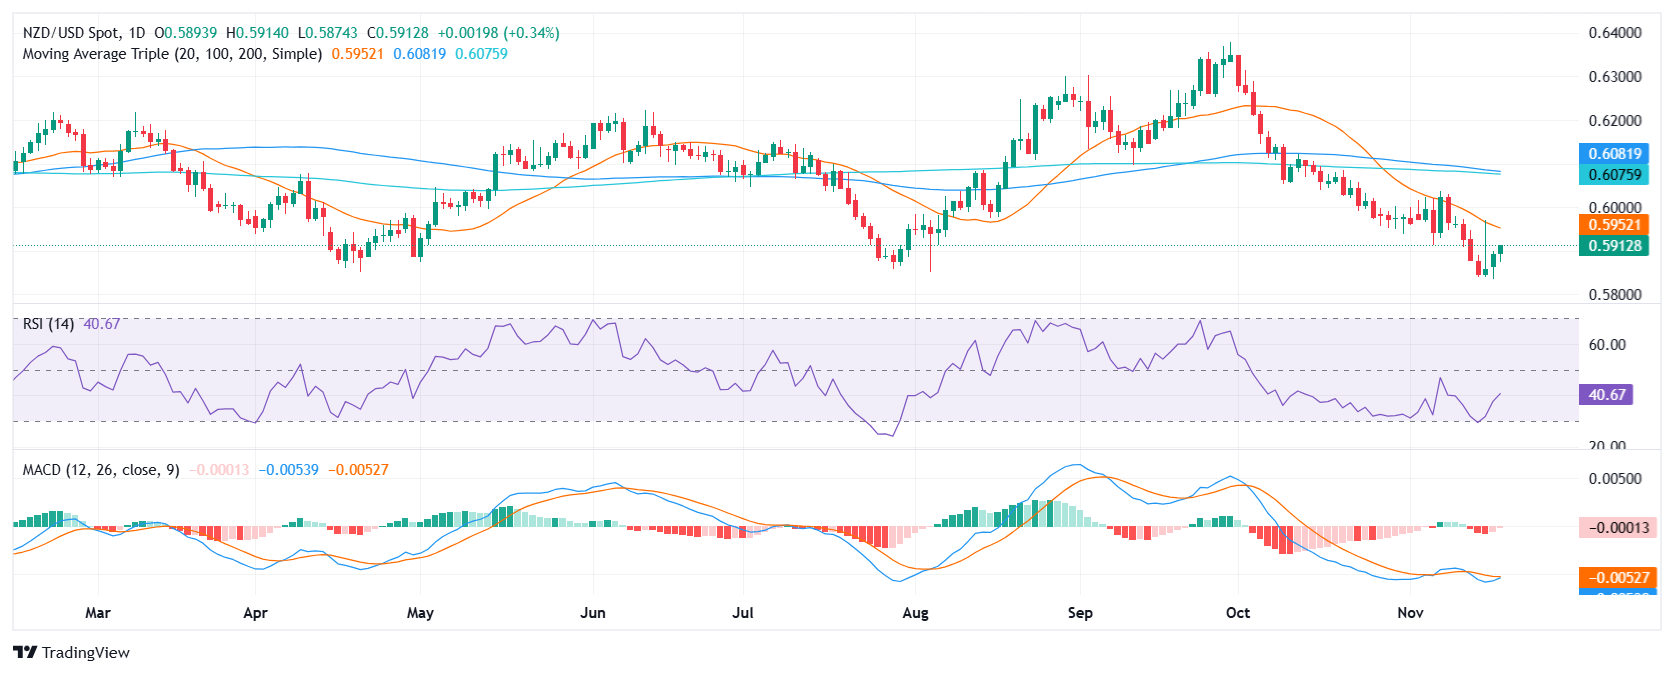
  • Buyers gained further ground and pushed back the sellers’ attempts as indicators continue in recovery mode.
  • The pair might continue to gain ground as it moves closer to its 20-day SMA at 0.5960.

The NZD/USD climbed by 0.31% to 0.5910 in Tuesday's session, continuing its recovery as buyers gained further ground and pushed back the sellers' attempts. Indicators such as the Relative Strength Index (RSI) and Moving Average Convergence Divergence (MACD) continue to recover, signaling a mixed momentum.

From a technical perspective, the NZD/USD's outlook is mixed with signs of a bullish recovery. The RSI's rise to 43 with its sharp upward slope suggests increasing buying pressure in the negative area and a potential recovery in bullish momentum. Additionally, the MACD's decreasing red histogram indicates a loss of bearish momentum. These mixed signals suggest a potential shift in market sentiment from bearish to bullish.

The NZD/USD pair's recovery continues as buyers regain control and push back sellers. The pair seems to be on its way towards the the 20-day Simple Moving Average (SMA) at 0.5960. As the pair trades near key resistance levels, a breakout above this level could strengthen bullish momentum, while a drop below 0.5900 could indicate a bearish reversal.

NZD/USD daily chart

Author

Patricio Martín

Patricio is an economist from Argentina passionate about global finance and understanding the daily movements of the markets.

More from Patricio Martín
Share:

Editor's Picks

AUD/USD eyes 0.7150 barrier nine-day EMA

AUD/USD inches higher after registering modest losses in the previous day, trading around 0.7130 during the Asian hours. The technical analysis of the daily chart indicates that the pair is moving sideways within the rectangle pattern, suggesting a consolidation as neither the bulls nor the bears have enough momentum to take control of the market.

USD/JPY trades below 160.00 intervention threshold; bullish bias intact

The USD/JPY pair attracts some sellers during the Asian session amid fears that authorities will step in again to prop up the Japanese Yen. Furthermore, the Israel-Lebanon truce prompts some profit-taking around the US Dollar and exerts downward pressure on the currency pair.

Gold puts its 200-day SMA to the test near $4,420

Gold keeps the bullish stance in place in the latter part of Thursday’s session, although a convincing break above the key $4,500 mark per troy ounce still remains elusive. The precious metal’s advance comes amid the resurgence of some selling interest around the Greenback, improving risk sentiment, and declining US Treasury yields across the board.

Bitcoin’s massive storm is back: Why the sell-off is far from over

Bitcoin price action over the last few weeks has felt less like a normal, healthy correction and more like a slow grinding crash that continues to wreak havoc on holdings and trading accounts. And everything suggests that the dramatic crash isn’t over.

Nonfarm payrolls: Testing the limits of Fed policy patience

The upcoming nonfarm payrolls report for May will provide the final update on the US labor market before Kevin Warsh attends his first policy meeting as the new Fed Chair later this month.

Recession on paper: What really moves the Canadian Loonie now?

Statistics Canada handed the headline writers a gift and the analysts a headache. Real GDP shrank 0.1% on an annualized basis in the first quarter, and with the fourth quarter of 2025 revised down to a 1.0% contraction, that is two negative quarters in a row, the textbook definition of a technical recession and Canada's first since the pandemic.