|

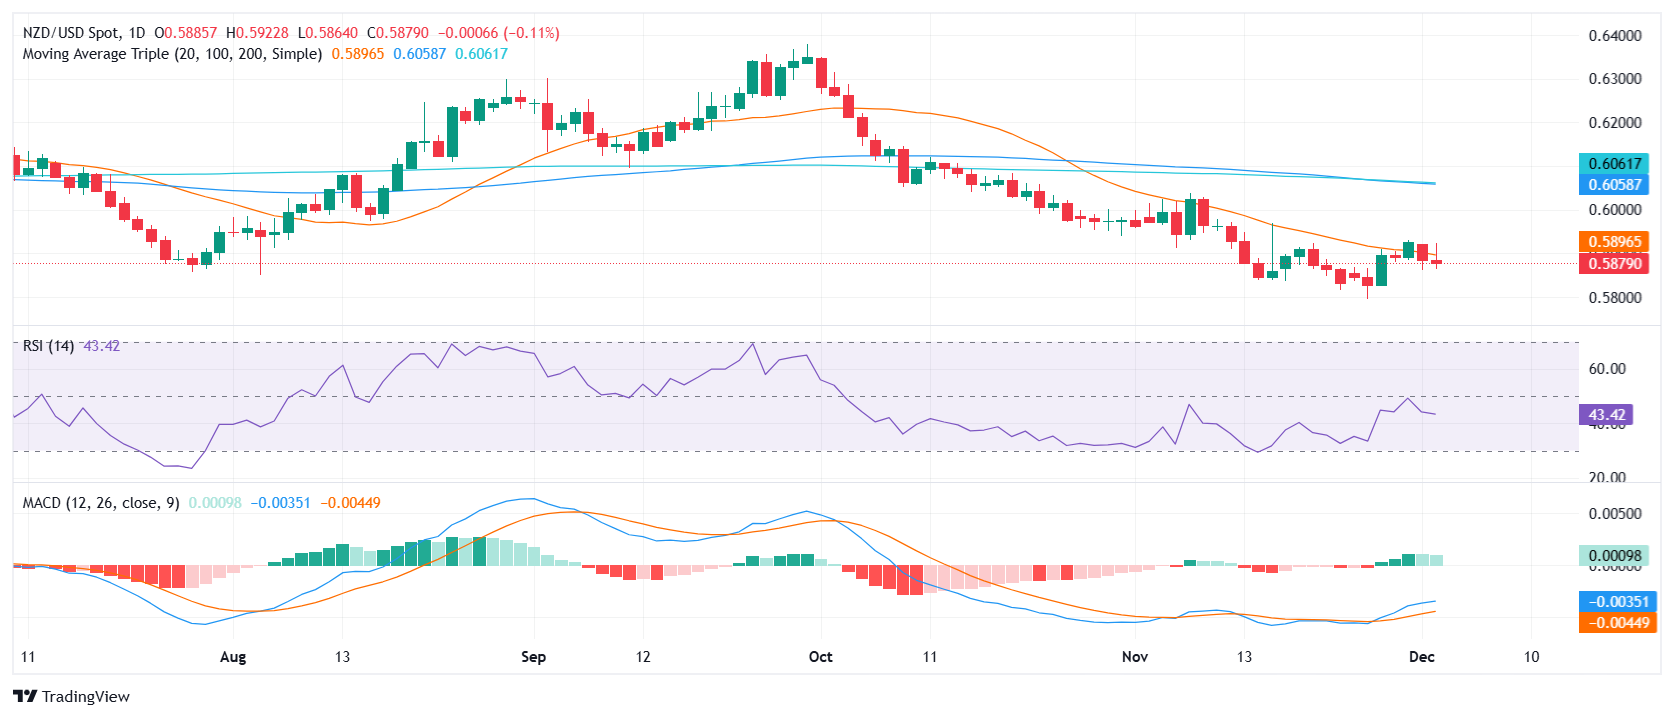
NZD/USD Price Analysis: Pair reversed gains after touching 20-day SMA above 0.5890

  • NZD/USD drops 0.10% on Tuesday, settling around 0.5880.
  • Bulls failed to sustain the break above the crucial 20-day SMA, pushing NZD/USD back below it again.
  • Indicators display mixed signals with hints of a bullish recovery.

The NZD/USD pair retreated on Tuesday's session, giving up the initial gains after reaching a daily high of 0.5890, just above its 20-day Simple Moving Average (SMA). The pair fell back below this crucial short-term moving average and settled around 0.5880, down 0.10% on the day. /p>

Despite retreating from its intraday high and displaying a slight downward bias, technical indicators for NZD/USD there are some signs of bullish presence. The Relative Strength Index (RSI), which indicates buying and selling pressure, has begun to recover with a mildly increasing slope, suggesting that buying pressure is gaining ground. Conversely, the Moving Average Convergence Divergence (MACD), a momentum indicator, has a declining histogram with a greenish tint, indicating that buying pressure is gradually decreasing. This mixed signal suggests a potential shift in market sentiment towards the upside.

That being said, the trailing technical outlook remains bearish, with the pair needing to reclaim the 20-day SMA to shift the momentum in favor of the bulls. Until that happens any signs of a bullish recovery may be invalidated

NZD/USD daily chart

Author

Patricio Martín

Patricio is an economist from Argentina passionate about global finance and understanding the daily movements of the markets.

More from Patricio Martín
Share:

Editor's Picks

AUD/USD regains mild traction, falters near 0.7150

AUD/USD gathers some steam and manages to flirt with the 0.7150 level on Thursday. However, the pair has retraced some of Wednesday’s significant pullback due to renewed selling pressure on the Greenback and a slight improvement in risk sentiment following hopes of a deal in the Middle East. Wrapping up the Australian docket, the RBA’s Hauser will speak early on Friday.

USD/JPY trades below 160.00 intervention threshold; bullish bias intact

The USD/JPY pair attracts some sellers during the Asian session amid fears that authorities will step in again to prop up the Japanese Yen. Furthermore, the Israel-Lebanon truce prompts some profit-taking around the US Dollar and exerts downward pressure on the currency pair.

Gold puts its 200-day SMA to the test near $4,420

Gold keeps the bullish stance in place in the latter part of Thursday’s session, although a convincing break above the key $4,500 mark per troy ounce still remains elusive. The precious metal’s advance comes amid the resurgence of some selling interest around the Greenback, improving risk sentiment, and declining US Treasury yields across the board.

XRP plummets as ETF outflows, geopolitical tensions reinforce bearish outlook
Ripple (XRP) edges lower, trading around $1.15 at the time of writing on Thursday, its lowest price since February 6. The cross-border money remittance token is extending the sell-off for the fifth consecutive day, reflecting persistent headwinds from ongoing geopolitical tensions and investor uncertainty.
Nonfarm payrolls: Testing the limits of Fed policy patience

The upcoming nonfarm payrolls report for May will provide the final update on the US labor market before Kevin Warsh attends his first policy meeting as the new Fed Chair later this month.

Recession on paper: What really moves the Canadian Loonie now?

Statistics Canada handed the headline writers a gift and the analysts a headache. Real GDP shrank 0.1% on an annualized basis in the first quarter, and with the fourth quarter of 2025 revised down to a 1.0% contraction, that is two negative quarters in a row, the textbook definition of a technical recession and Canada's first since the pandemic.