|

NZD/USD Price Analysis: On its way to print inverse head-and-shoulders

  • NZD/USD stays pressured near 0.6650 while keeping range from Tuesday’s US session.
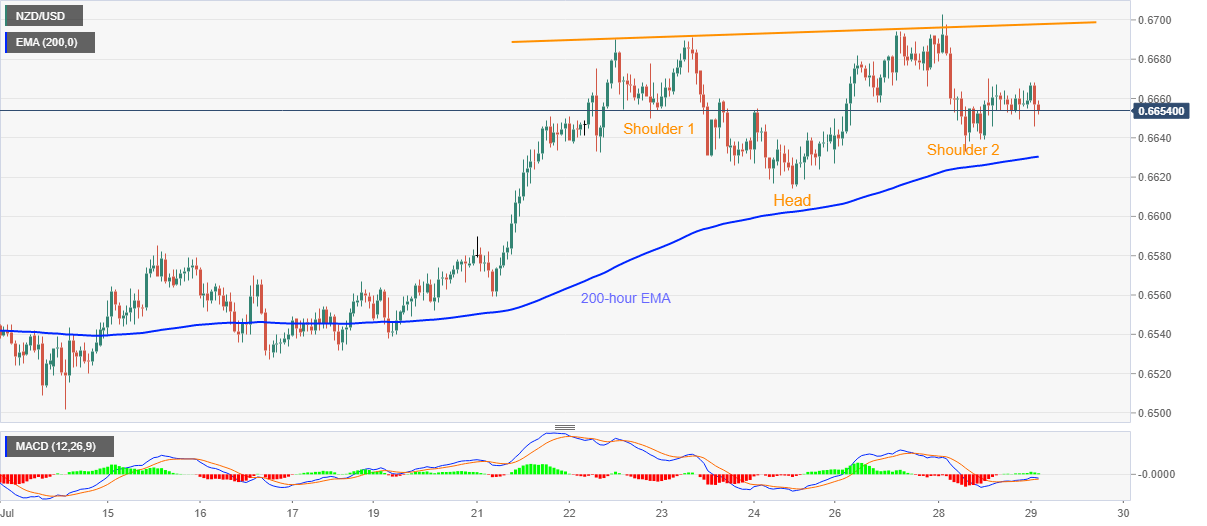
  • A bullish chart formation is gradually gaining momentum but 0.6700 becomes the key.
  • 200-hour EMA acts as the near-term strong support.

NZD/USD weakens to 0.6655 amid the initial trading session on Wednesday. The quote recently dropped to the intraday low of 0.6646 on downbeat fundamentals from its largest customer Australia. Though, sustained trading beyond near-term key moving average and bullish MACD keeps the buyers hopeful to gain confirmation of a bullish pattern.

While a clear break of 0.6700 could give a free hand to the buyers targeting December 31, 2019 top near 0.6760, 0.6675 acts as an immediate upside barrier for the pair to cross.

It should, however, be noted that the quote’s further rise past-0.6760 will eye for July 2019 peak surrounding 0.6790 ahead of confronting the 0.6800 threshold.

On the contrary, a downside break of a 200-hour EMA level of 0.6630 will challenge July 24 bottom close to 0.6615 and then decline towards 0.6600 round-figure.

In a case where the bears keep the reins past-0.6600, the mid-month peak of 0.6585 and the monthly low close to 0.6440 could regain market attention.

NZD/USD hourly chart

Trend: Bullish

Additional important levels

Overview
Today last price0.6657
Today Daily Change-3 pips
Today Daily Change %-0.05%
Today daily open0.666
 
Trends
Daily SMA200.6578
Daily SMA500.6454
Daily SMA1000.6225
Daily SMA2000.6353
 
Levels
Previous Daily High0.6703
Previous Daily Low0.6633
Previous Weekly High0.6691
Previous Weekly Low0.6538
Previous Monthly High0.6585
Previous Monthly Low0.6186
Daily Fibonacci 38.2%0.666
Daily Fibonacci 61.8%0.6676
Daily Pivot Point S10.6628
Daily Pivot Point S20.6595
Daily Pivot Point S30.6558
Daily Pivot Point R10.6698
Daily Pivot Point R20.6735
Daily Pivot Point R30.6768

Author

Anil Panchal

Anil Panchal

FXStreet

Anil Panchal has nearly 15 years of experience in tracking financial markets. With a keen interest in macroeconomics, Anil aptly tracks global news/updates and stays well-informed about the global financial moves and their implications.

More from Anil Panchal
Share:

Editor's Picks

EUR/USD: Cautiously optimistic near 1.1550 ahead of the ECB

EUR/USD extends its weekly recovery for the third day in a row on Wednesday, navigating in a sidelined fashion around 1.1550 on the back of humble losses in the US Dollar. In the meantime, market participants continue to closely follow developments in the Middle East while slowly gearing up for the ECB gathering on Thursday.

GBP/USD recedes from tops, hovers around 1.3400

GBP/USD could not sustain the initial bull run and is now slipping back toward the 1.3400 neighbourhood on Wednesday. Cable’s continuation of the ongoing leg higher follows mild selling pressure on the Greenback, despite steady uncertainty on the geopolitical front and elevated US inflation.

Gold bleeding continues as Middle East crisis escalates, Fed hike coming

Gold is accelerating its downward trends and approaches the area of $4,100 per troy ounce on Wednesday, where the 2026 bottom sits so far. The persistent decline in the precious metal almost exclusively follows the swelling opinion that the Fed will keep a cautious stance in H2, a view that was reinforced following earlier US CPI data.

$1,500: Why Ethereum just crashed 20% despite spot markets barely selling
Ethereum (ETH) recently suffered one of its sharpest declines of 2026, dropping more than 20% and briefly testing the $1,500 area. While the sell-off appeared to reflect broader market fears, derivatives and on-chain data suggest a more complex story may be unfolding beneath the surface.
Brutal sell-off: Silver deepens months-long slide, refocusing on $60

Silver has never been known for its calm temperament. The precious metal can spend weeks grinding higher before suddenly giving back months of gains in a matter of days. That volatile reputation has been on full display in recent weeks.

The US economy defies the rules: 100 days into the Oil shock and the recession signal is still missing

More than three months after the start of the Iran war and the resulting disruption to global energy markets, the US economy continues to display remarkable resilience. The conflict has triggered a sharp rise in Oil prices, reignited inflationary pressures and fueled widespread concerns about a potential economic slowdown.