|

NZD/USD Price Analysis: Mixed outlook as indicators signal potential shift

  • Technical indicators suggest a gradual recovery of buying pressure, but resistance at the 20-day SMA may hinder further gains.
  • Indeed, the buyers got rejected at the mentioned average which made the pair trim daily gains.

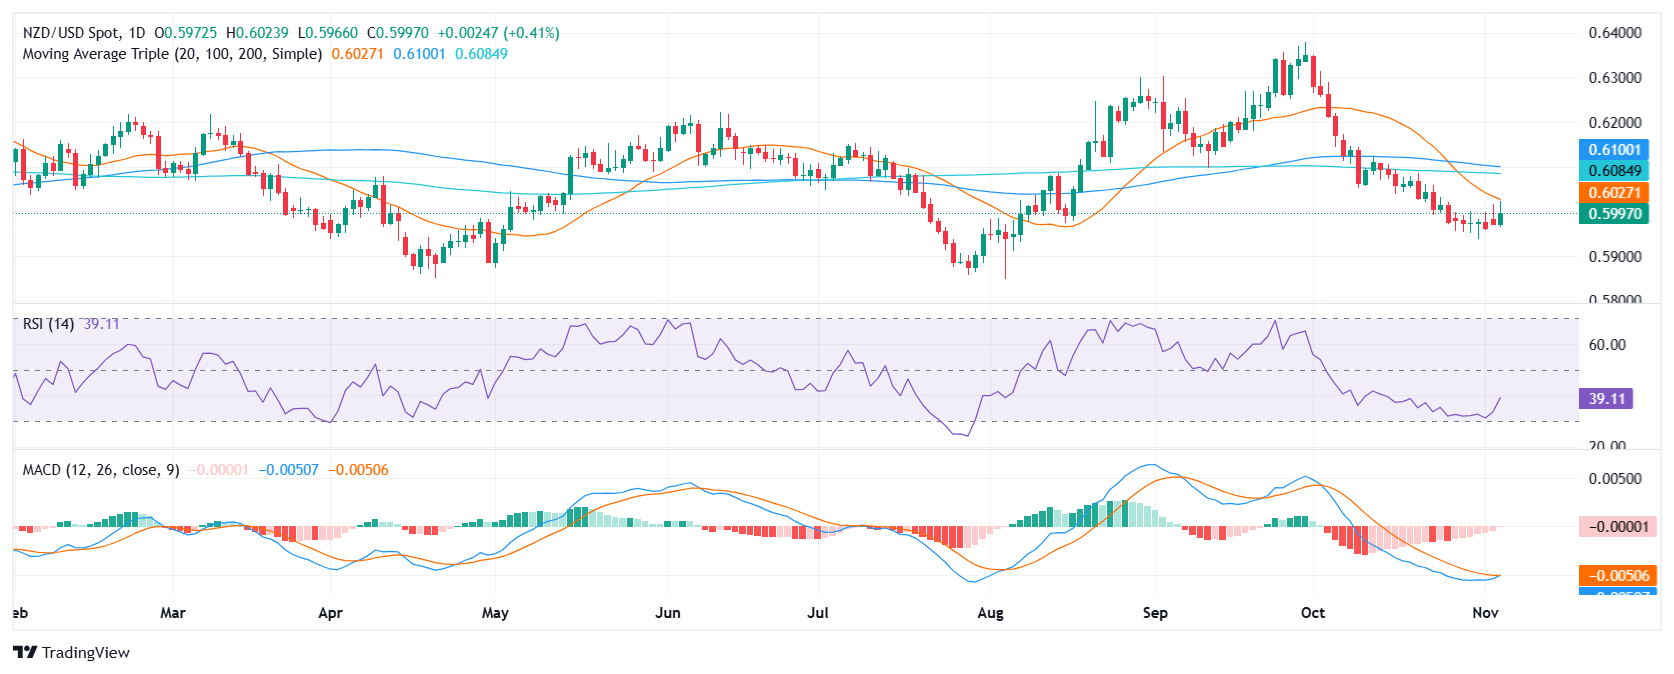
The NZD/USD pair has resumed its choppy movement, with a an upward bias, after a brief dip below the 0.6000 support. The pair is currently trading around 0.5994, facing resistance at the 20-period Simple Moving Average (SMA), which has capped further gains in recent sessions.

Technical indicators are recovering, suggesting a potential shift in momentum. The Relative Strength Index (RSI) is gradually recovering from oversold territory, indicating a recovery in buying pressure. However, the Moving Average Convergence Divergence (MACD) histogram remains negative, suggesting that selling pressure is still dominant.

If the RSI continues to rise and the MACD turns positive, it could indicate a shift towards a bullish trend. Conversely, if the RSI falls back into oversold territory and the MACD continues to decline, it could signal a continuation of the downtrend.

The pair is facing resistance at 0.6000, 0.6030, and 0.6040, while support is at 0.5960, 0.5930, and 0.5900. 

NZD/USD daily chart

Author

Patricio Martín

Patricio is an economist from Argentina passionate about global finance and understanding the daily movements of the markets.

More from Patricio Martín
Share:

Editor's Picks

EUR/USD tests nine-day EMA support near 1.1850

EUR/USD inches lower during the Asian hours on Monday, trading around 1.1870 at the time of writing. The 14-day Relative Strength Index momentum indicator at 56 stays above the midline, confirming improving momentum. RSI has cooled from prior overbought readings but stabilizes above 50, suggesting dips could stay limited before buyers reassert control.

GBP/USD flat lines as traders await key UK macro data and FOMC minutes

The GBP/USD pair kicks off a new week on a subdued note and oscillates in a narrow range, just below mid-1.3600s, during the Asian session. Moreover, the mixed fundamental backdrop warrants some caution for aggressive traders as the market focus now shifts to this week's important releases from the UK and the US.

Gold slides below $5,000 amid USD uptick and positive risk tone; downside seems limited

Gold attracts fresh sellers at the start of a new week and reverses a part of Friday's strong move up of over $150 from sub-$4,900 levels. The commodity slides back below the $5,000 psychological mark during the Asian session, though the downside potential seems limited amid a combination of supporting factors.

Bitcoin, Ethereum and Ripple consolidate within key ranges as selling pressure eases

Bitcoin and Ethereum prices have been trading sideways within key ranges following the massive correction. Meanwhile, XRP recovers slightly, breaking above the key resistance zone. The top three cryptocurrencies hint at a potential short-term recovery, with momentum indicators showing fading bearish signs.

Global inflation watch: Signs of cooling services inflation

Realized inflation landed close to expectations in January, as negative base effects weighed on the annual rates. Remaining sticky inflation is largely explained by services, while tariff-driven goods inflation remains limited even in the US.

Ripple Price Forecast: XRP potential bottom could be in sight

Ripple edges up above the intraday low of $1.35 at the time of writing on Friday amid mixed price actions across the crypto market. The remittance token failed to hold support at $1.40 the previous day, reflecting risk-off sentiment amid a decline in retail and institutional sentiment.