|

NZD/USD Price Analysis: Kiwi trades near 0.5700 as short-term bullish bias builds momentum

  • NZD/USD trades near the 0.5700 area after posting solid gains ahead of the Asian session
  • Shorter-term moving averages point to a bullish bias despite mixed indicator signals
  • Support sits in the mid-0.5700 while resistance emerges closer to the 0.5800 zone

The NZD/USD pair extended its upside momentum during Thursday’s session, climbing toward the 0.5700 area after posting notable intraday gains. The pair remains comfortably positioned within its daily range of 0.56282 to 0.57656, reflecting growing bullish sentiment in the short term.

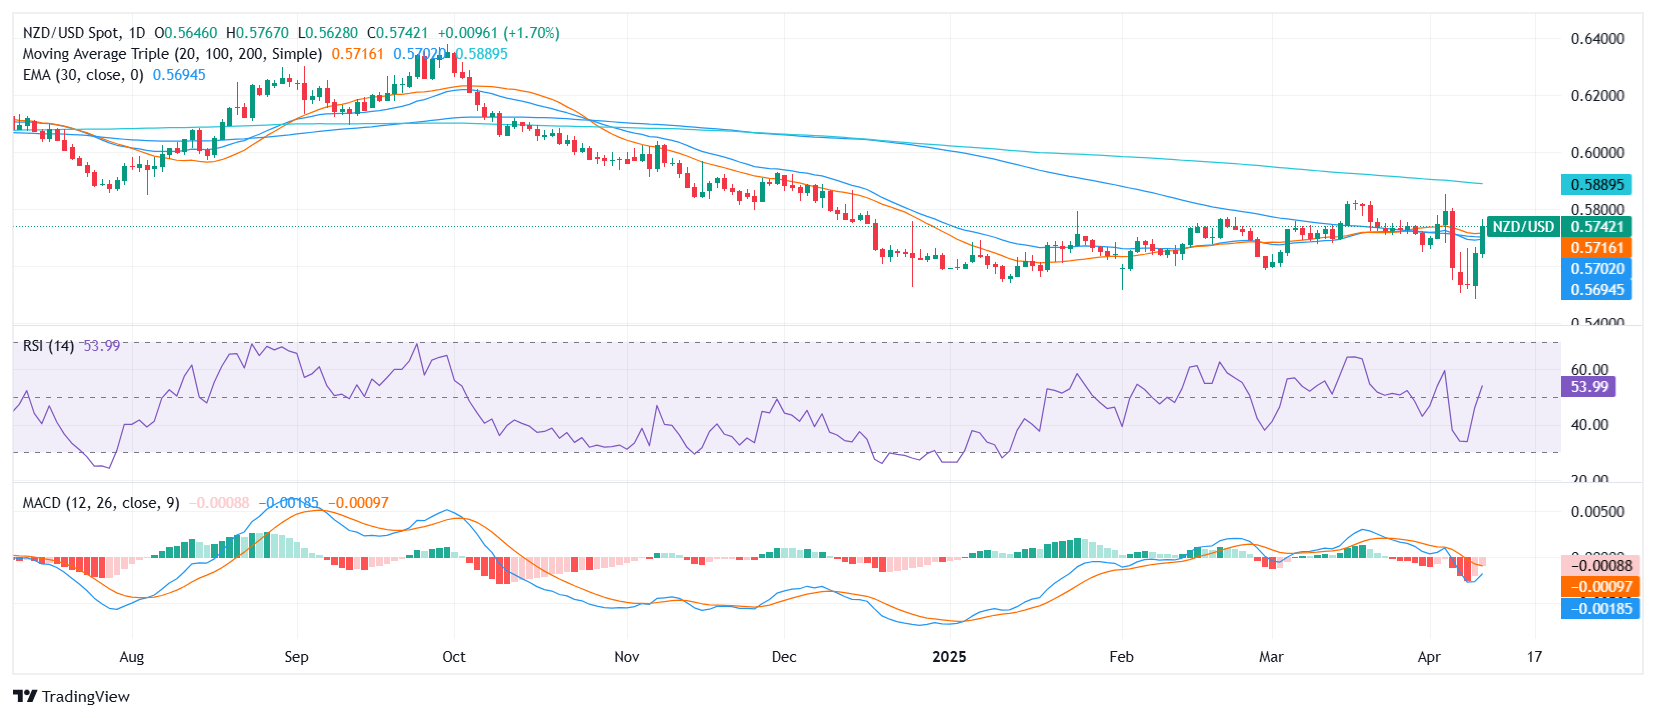
From a technical perspective, the Relative Strength Index (RSI) currently prints at 53.82, indicating neutral momentum but improving to positive area, while the Moving Average Convergence Divergence (MACD) continues to suggest a sell signal. Despite this, the shorter-term moving averages are aligning in support of the ongoing bullish movement. The 10-day EMA at 0.56685 and the 10-day SMA at 0.56688 both point upward, followed closely by the 20-day SMA at 0.57156 and the 100-day SMA at 0.57072—further validating the short-term bullish bias.

Meanwhile, the 200-day SMA at 0.58946 may act as a longer-term resistance threshold. The Stochastic RSI Fast at 41.67 and the Awesome Oscillator at -0.00854 remain neutral, adding no immediate conviction to the directional bias.

Daily chart

Author

Patricio Martín

Patricio is an economist from Argentina passionate about global finance and understanding the daily movements of the markets.

More from Patricio Martín
Share:

Editor's Picks

AUD/USD falls to near 0.7100 after slipping below 50-day EMA

AUD/USD depreciates after registering minor gains in the previous day, trading around 0.7120 during the Asian hours. The technical analysis of the daily chart shows the pair consolidating sideways within a rectangle pattern, as neither bulls nor bears gain control. The AUD/USD pair is holding a slight bearish tone however as it sits beneath both the nine-day and 50-day EMAs.

USD/JPY coiling up around 160.00 amid 'Yentervention' threats

USD/JPY sits glued near 160.00 in Asia on Friday, as the Japanese Yen remains supported by persistent 'Yentervention' threats by Japan's officials. However, the pair's downside remains capped by the Mideast tensions-led risk-off mood and the US Dollar's bullish consolidation.

Gold returns to the red, awaits US NFP

Gold price is looking to test the weekly lows, while in the red near $4,450 in the early European session on Friday. The precious metal remains vulnerable amid ongoing geopolitical turmoil. Traders will closely monitor the developments surrounding the US-Iran peace deal and the US May employment report later on Friday.


Indian Rupee jumps as RBI holds, but unveils measures to boost foreign inflows

The Reserve Bank of India held the Repo Rate at 5.25%, as widely expected, on Friday. But the central bank unveiled various measures to boost foreign inflows into the economy, lifting the Indian Rupee against the US Dollar.

Top 3 Price Prediction: Bitcoin eyes $60,000, Ethereum risks $1,750, XRP could test $1

Bitcoin, Ethereum, and Ripple prices edge lower on Friday, extending a steady decline of roughly 15% so far this week. Institutional outflows weigh on Bitcoin and Ethereum while XRP largely follows the broader market trend.

Recession on paper: What really moves the Canadian Loonie now?

Statistics Canada handed the headline writers a gift and the analysts a headache. Real GDP shrank 0.1% on an annualized basis in the first quarter, and with the fourth quarter of 2025 revised down to a 1.0% contraction, that is two negative quarters in a row, the textbook definition of a technical recession and Canada's first since the pandemic.