|

NZD/USD Price Analysis: Kiwi melts down to two-month lows near 0.6400 figure

  • NZD/USD is under heavy bearish pressure as sellers are printing fresh 2020 lows. 
  • The level to beat for sellers is the 0.6399 support.
 

NZD/USD daily chart

 
NZD/USD printed a fresh 2020 low as bears are challenging the 0.6399 support. As the market is under heavy selling pressure a break below the above-mentioned support can lead to further losses towards the 0.6365 and 0.6352 price levels on the way down, according to the Technical Confluences Indicator. Looking up, resistances are seen near the 0.6412, 0.6435 and 0.6465 price levels.  
  
 
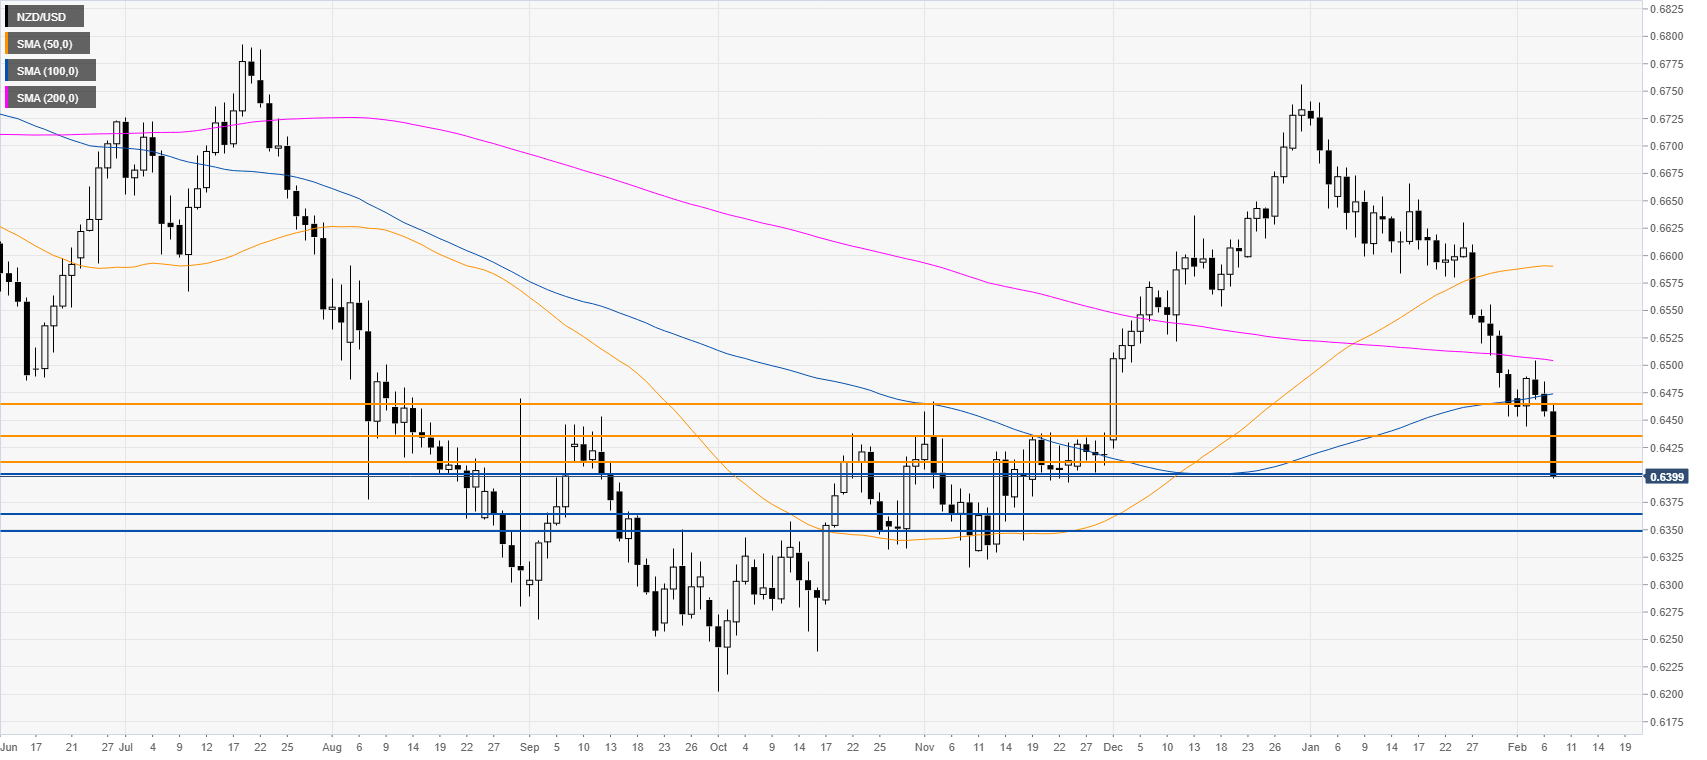
Resistance: 0.6412, 0.6435, 0.6465
Support: 0.6399, 0.6365, 0.6352
 

Additional key levels

NZD/USD

Overview
Today last price0.64
Today Daily Change-0.0058
Today Daily Change %-0.90
Today daily open0.6458
 
Trends
Daily SMA200.6561
Daily SMA500.6591
Daily SMA1000.6472
Daily SMA2000.6505
 
Levels
Previous Daily High0.6485
Previous Daily Low0.6453
Previous Weekly High0.661
Previous Weekly Low0.6453
Previous Monthly High0.6741
Previous Monthly Low0.6453
Daily Fibonacci 38.2%0.6465
Daily Fibonacci 61.8%0.6473
Daily Pivot Point S10.6446
Daily Pivot Point S20.6433
Daily Pivot Point S30.6414
Daily Pivot Point R10.6478
Daily Pivot Point R20.6497
Daily Pivot Point R30.651

Author

Flavio Tosti

Flavio Tosti

Independent Analyst


More from Flavio Tosti
Share:

Editor's Picks

EUR/USD: Breakdown below trading range support near 1.1770 comes into play

The EUR/USD pair opens with a bearish gap at the start of a new week as the US-Iran war-led global flight to safety boosts the US Dollar. Spot prices, however, lack follow-through selling and manage to hold above mid-1.1700s during the Asian session.

GBP/USD targets 1.3500 barrier near moving averages

GBP/USD rebounds from the daily losses, trading around 1.3450 during the Asian hours on Monday. The technical analysis of the daily chart indicates an ongoing bearish bias, as the pair trades within a descending channel pattern.

Gold retreats from $5,400; still up over 1% amid Middle East tensions

Gold retreats from the $5,400 neighborhood, or its highest level since late January, touched in the Asian session on Monday, though it manages to hold above the $5,300 round figure. The bright metal opened with a bullish gap of about $17 and rallied toward the $5,400 level as Asian traders hit their desks and reacted negatively to the weekend news of the US and Israel attacks on Iran, rushing for cover in Gold.

Top Crypto Losers: Tezos, Toncoin, and Polkadot at crucial levels amid US-Israel strike on Iran

Altcoins such as Tezos, Toncoin, and Polkadot rank among the worst hit cryptocurrencies over the last 24 hours amid the US and Israel's attack on Iran. Tezos and Toncoin are down to crucial support levels while Polkadot remains near a crucial resistance trendline, showcasing underlying strength.

The market is paying for insurance, not apocalypse

As expected, this morning felt less like a Monday market open and more like a fire drill. Futures screens flickered red. S&P contracts down almost 1%. Nasdaq off 1.2%. Brent leaped 13% through $80. Gold rose 1.6% toward $5350 before paring some gains. The dollar is strutting mildly. The Swiss franc is quietly doing what it always does in a storm, catching some safe-haven flows.

Starknet unveils strkBTC, shielded Bitcoin transactions on Ethereum Layer 2

Starknet, the Ethereum Layer 2 network developed by StarkWare, today announced strkBTC, a wrapped Bitcoin asset that introduces optional shielding while preserving full DeFi composability.