NZD/USD Price Analysis: H&S in action amid risk-off market mood
- NZD/USD has gauged intermediate support near 0.6140, however, more downside seems favored amid uncertainty.
- Investors should note that core inflation in the US economy has remained extremely persistent.
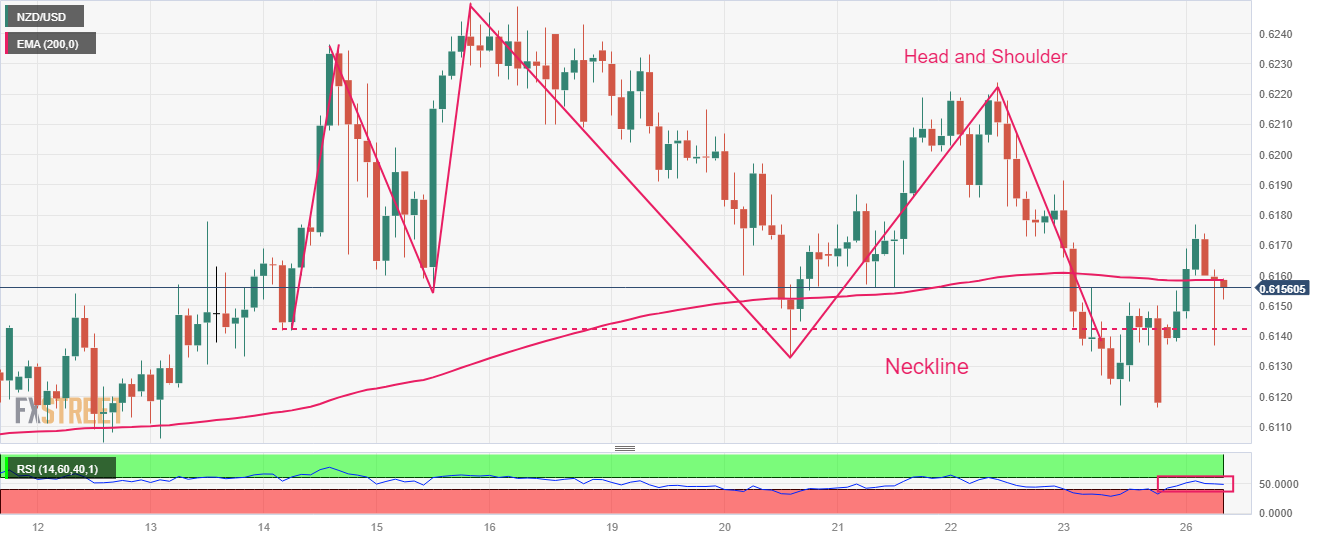
- NZD/USD has formed a Head and Shoulder chart pattern on a two-hour scale, which indicates a prolonged consolidation.

The NZD/USD pair has found intermediate support near 0.6140 in the European session. The Kiwi asset is expected to show a volatile action as the US Dollar Index (DXY) is looking to conclude its corrective move.
S&P500 futures have posted losses in London, portraying a further decline in the risk appetite of the market participants. The risk of global recession is driving market mood and has trimmed the appeal for risk-sensitive assets.
The US Dollar will remain in action ahead of the release of the Durable Goods Orders data. Investors should note that core inflation in the United States economy has remained extremely persistent due to rising prices for services and durable goods.
NZD/USD has formed a Head and Shoulder chart pattern on a two-hour scale, which indicates a prolonged consolidation. A breakdown of the same confirms a bearish reversal. The neckline of the aforementioned chart pattern is plotted from June 14 low at 0.6142.
The Kiwi asset is struggling to maintain an auction above the 200-period Exponential Moving Average (EMA) at 0.6159, which indicates that the long-term trend is not bullish.
Meanwhile, the Relative Strength Index (RSI) (14) is oscillating in the 40.00-60.00 range, indicating a non-directional performance.
A downside move below the June 16 low at 0.6116 will expose the asset to June 05 low at 0.6041. A slippage below the latter would expose the asset to psychological support at 0.6000.
Alternatively, a confident break above May 17 high at 0.6261 will drive the Kiwi asset toward May 19 high at 0.6306 followed by May 08 high around 0.6360.
NZD/USD two-hour chart
Author

Sagar Dua
FXStreet
Sagar Dua is associated with the financial markets from his college days. Along with pursuing post-graduation in Commerce in 2014, he started his markets training with chart analysis.


