|

NZD/USD Price Analysis: Hovers near 50-day EMA; bullish signals emerging amid mixed bias

  • NZD/USD is trading at 0.6154, showing minimal gains of 0.11%.
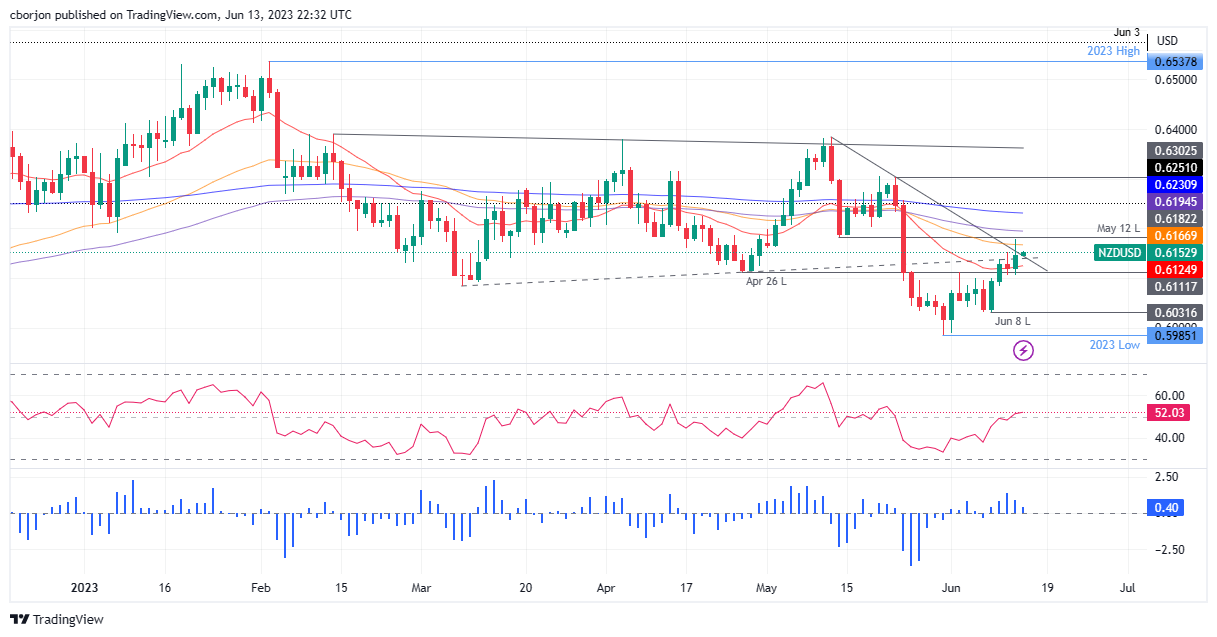
  • Key support levels are April 26 low at 0.6111, the June 8 low of 0.6032, and the year-to-date (YTD) low at 0.5985.
  • Bullish signs are apparent in oscillators, yet they suggest a mixed bias due to a slightly above-midline RSI and falling three-day RoC.

NZD/USD is still consolidated despite breaching previous resistance at the 20-day Exponential Moving Average (EMA) at 0.6125. However, failure to clear the 50-day EMA at 0.6167, the NZD/USD pair trimmed some of its gains, registering a gain of 0.43%. As the Asian session commences, the NZD/USD trades at 0.6154, reporting minimal gains of 0.11%.

NZD/USD Price Analysis: Technical outlook

The NZD/USD is neutral to a downward bias, albeit breaking a downslope resistance trendline that intersects with the 50-day EMA. For the NZD/USD to shift the bias to neutral, buyers must reclaim the May 12 swing low-turned resistance at 0.6182 before the NZD/USD could challenge the 0.62 handle. On the other hand, to resume its bearish bias, the NZD/USD needs to drop below the 20-day EMA at 0.6124 for the pair to extend its losses.

In the outcome of the latter scenario, the next support would be April 26, low at 0.6111. A break below that area and the NZD/USD would surpass the next support at 0.6100 as the pair continues to test the June 8 low of 0.6032. Once cleared, the year-to-date (YTD) low would be up for grabs at 0.5985.

From an oscillator point of view, bullish signals are emerging but are still in the early stages of a shift to a neutral bias. The Relative Strength Index (RSI) is slightly above 50-midline; while the three-day Rate of Change (RoC) portrays buyers are losing momentum. Hence, the bias is mixed.

NZD/USD Price Action – Daily chart

NZD/USD Daily chart

NZD/USD

Overview
Today last price0.6151
Today Daily Change0.0028
Today Daily Change %0.46
Today daily open0.6123
 
Trends
Daily SMA200.6119
Daily SMA500.6185
Daily SMA1000.623
Daily SMA2000.6149
 
Levels
Previous Daily High0.6154
Previous Daily Low0.6105
Previous Weekly High0.6143
Previous Weekly Low0.6026
Previous Monthly High0.6385
Previous Monthly Low0.5985
Daily Fibonacci 38.2%0.6135
Daily Fibonacci 61.8%0.6124
Daily Pivot Point S10.6101
Daily Pivot Point S20.6078
Daily Pivot Point S30.6052
Daily Pivot Point R10.615
Daily Pivot Point R20.6176
Daily Pivot Point R30.6199

Author

Christian Borjon Valencia

Markets analyst, news editor, and trading instructor with over 14 years of experience across FX, commodities, US equity indices, and global macro markets.

More from Christian Borjon Valencia
Share:

Editor's Picks

EUR/USD eyes nine-day EMA barrier after rebounding from 1.1600

EUR/USD gains ground after registering modest losses in the previous session, trading around 1.1620 during the Asian hours on Friday. The technical analysis of the daily chart suggests an ongoing bearish bias as the pair remains within the descending channel pattern.

GBP/USD: Pound Sterling ticks up against US Dollar in countdown to US NFP

The Pound Sterling trades marginally higher to near 1.3365 against the US Dollar during the Asian trading session on Friday. The GBP/USD pair edges up as the US Dollar ticks down ahead of the United States Nonfarm Payrolls data for February, which will be published at 13:30 GMT.

Gold awaits US Nonfarm Payrolls for a clear directional impetus

Gold rebounds above $5,100 early Friday after testing the $5,050 level amid global sell-off. The US Dollar pulls back as profit-taking creeps in ahead of US labor data. For February. 21-day SMA holds amid bullish RSI; a daily closing above 61.8% Fibo is critical for Gold buyers.

Ethereum pull in $169M as validators pile in to stake ETH

US spot Ethereum exchange-traded funds recorded $169 million in net inflows on Wednesday, marking the largest daily intake in two months, according to SoSoValue data. The rise in inflows signals renewed institutional interest in Ethereum amid broader market volatility.

The market compass is pointing at a barrel of Oil

The Asian open is arriving with equities leaning the wrong way, and the reason is not complicated. The market’s compass needle has snapped firmly toward crude. In this tape, oil is not just another input price; it is the gravitational center around which every asset class is orbiting.

Ripple tests recovery strength amid steady ETF inflows, growing retail interest

Ripple (XRP) continues to demonstrate notable resilience as the cryptocurrency market navigates the persistent war in the Middle East after the United States (US) and Israel attacked Iran on Saturday.