|

NZD/USD Price Analysis: Fresh upside looks warranted above 0.6280 as hawkish Fed bets fade

  • NZD/USD is oscillating around 0.6220, resumption in the upside is expected ahead of US CPI.
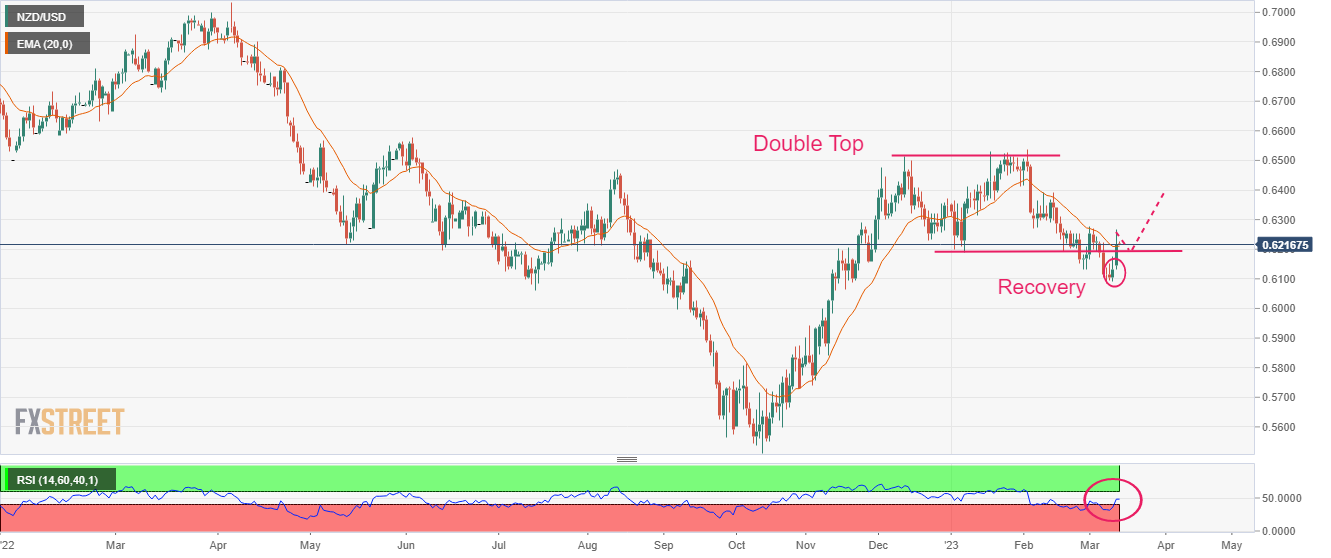
  • After a responsive buying, NZD/USD has negated the breakdown of the Double Top chart pattern.
  • A decent recovery from the RSI (14) into the 40.00-60.00 range indicates that the presence of responsive buyers.

The NZD/USD pair has turned sideways around 0.6220 in the early Tokyo session after a corrective move from 0.6260. A resumption in the upside momentum is expected from the Kiwi asset as the catastrophic collapse of Silicon Valley Bank (SVB) has faded the hopes of a hawkish stance on the interest rates by the Federal Reserve (Fed).

On the interest rate hike outlook, Goldman Sachs believes "In light of recent stress in the banking system, we no longer expect the FOMC to deliver a rate hike at its March 22 meeting with considerable uncertainty about the path beyond March."

A decent rebound is shown by the S&P500 futures, indicating an improvement in the risk appetite of the market participants. However, caution on a broad basis cannot be ruled out.

The US Dollar Index (DXY) has shown a less-confident recovery from 103.50 and is expected to remain volatile ahead of the release of the Consumer Price Index (CPI) ahead.

NZD/USD has negated the breakdown of the Double Top chart pattern formed on a daily scale. A responsive buying in the Kiwi asset has pushed it above the critical resistance plotted from January 06 low at 0.6190.

The asset is attempting to shift its auction above the 20-period Exponential Moving Average (EMA) at 0.6207, which will improve the short-term upside bias.

A decent recovery from the Relative Strength Index (RSI (14) into the 40.00-60.00 range indicates that the presence of responsive buyers at lower levels.

A buying opportunity in the Kiwi asset will emerge it will surpass March 1 high at 0.6276, which will drive the pair toward the round-level resistance at 0.6300 followed by February 14 high at 0.6389.

In an alternate scenario, a breakdown of January 6 low at 0.6193 will drag the asset toward November 28 low at 0.6155. A slippage below the latter will expose the asset for more downside toward the round-level support at 0.6100.

NZD/USD daily chart

NZD/USD

Overview
Today last price0.6217
Today Daily Change0.0085
Today Daily Change %1.39
Today daily open0.6132
 
Trends
Daily SMA200.6213
Daily SMA500.6319
Daily SMA1000.624
Daily SMA2000.6168
 
Levels
Previous Daily High0.6177
Previous Daily Low0.6091
Previous Weekly High0.6226
Previous Weekly Low0.6084
Previous Monthly High0.6538
Previous Monthly Low0.6131
Daily Fibonacci 38.2%0.6144
Daily Fibonacci 61.8%0.6124
Daily Pivot Point S10.609
Daily Pivot Point S20.6047
Daily Pivot Point S30.6004
Daily Pivot Point R10.6176
Daily Pivot Point R20.6219
Daily Pivot Point R30.6262

Author

Sagar Dua

Sagar Dua

FXStreet

Sagar Dua is associated with the financial markets from his college days. Along with pursuing post-graduation in Commerce in 2014, he started his markets training with chart analysis.

More from Sagar Dua
Share:

Editor's Picks

GBP/USD surges to multi-day peaks past 1.3250

GBP/USD leaves behind Friday’s small pullback and advances past 1.3250 level, or five-day highs, on Monday. Cable’s upside follows extra losses in the Greenback, while traders continue to assess the geopolitical front and upcoming key events.

EUR/USD pops to daily highs near 1.1430

EUR/USD starts the week on a positive note, climbing to as high as the 1.1430 zone, or daily tops, on Monday. The pair’s recovery comes in response to the broad-based US Dollar weakness, while investors continue to monitor developments from the Middle East ahead of the beginning of the ECB's annual forum.

Gold remains supported by $4,000

Gold remains under marked selling pressure, holding on just above the key $4,000 mark per troy ounce at the beginning of the week. The precious metal reverses two daily advances in a row as renewed effervescence in the Middle East revive inflation concerns and bolster Fed rate hike expectations.

Bitcoin four-year cycle: BTC risks 75% drawdown with four months of bear market still ahead

Bitcoin price continues to trend downward below the $60,000 support zone after losing over 50% of its value since the $126,199 high in October. Bitcoin’s four-year cycle, measured from cycle tops to bottoms, suggests that four months of a bear market are still ahead.

Just like Fed, is BoJ’s independence under threat?

When talking about central bank independence, most of the focus has been on Donald Trump’s pressure on the Federal Reserve. But a similar story, a quieter one for now, seems to be happening on the other side of the Pacific: Japan’s government may be testing the Bank of Japan’s independence.

Kevin Warsh isn't expected to say much in Sintra: That's exactly why markets will listen

Financial markets could find an important catalyst in the enchanting, fairytale-like landscape of Sintra this week. The ECB Forum will, as it does every year, gather the crème de la crème of central banks. The new boss at the Fed, who has clearly said that the Fed should stop explaining everything, will need to talk – and traders should listen.