NZD/USD Price Analysis: Forms bearish candlestick at top of range
- NZD/USD has formed a bearish reversal candlestick at its range highs and declined.
- This suggests the possibility it could be about to move down towards the range lows.
- The pair may be entering a sideways trend with odds favoring an extension of the range.

NZD/USD may be entering a sideways trend after touching the top of a multi-week range and rolling over. If it is in a sideways trend and given “the trend is your friend” it is more likely than not to continue oscillating within the confines of the range.
NZD/USD surged to a high of 0.6248 on August 20 before falling back down just as rapidly. The swift change in price led to the formation of a bearish Gravestone Doji Japanese candlestick formation (circled) which was followed by a red candlestick in the subsequent period providing added bearish confirmation. Such a pattern signals a short-term reversal.
NZD/USD 4-hour Chart
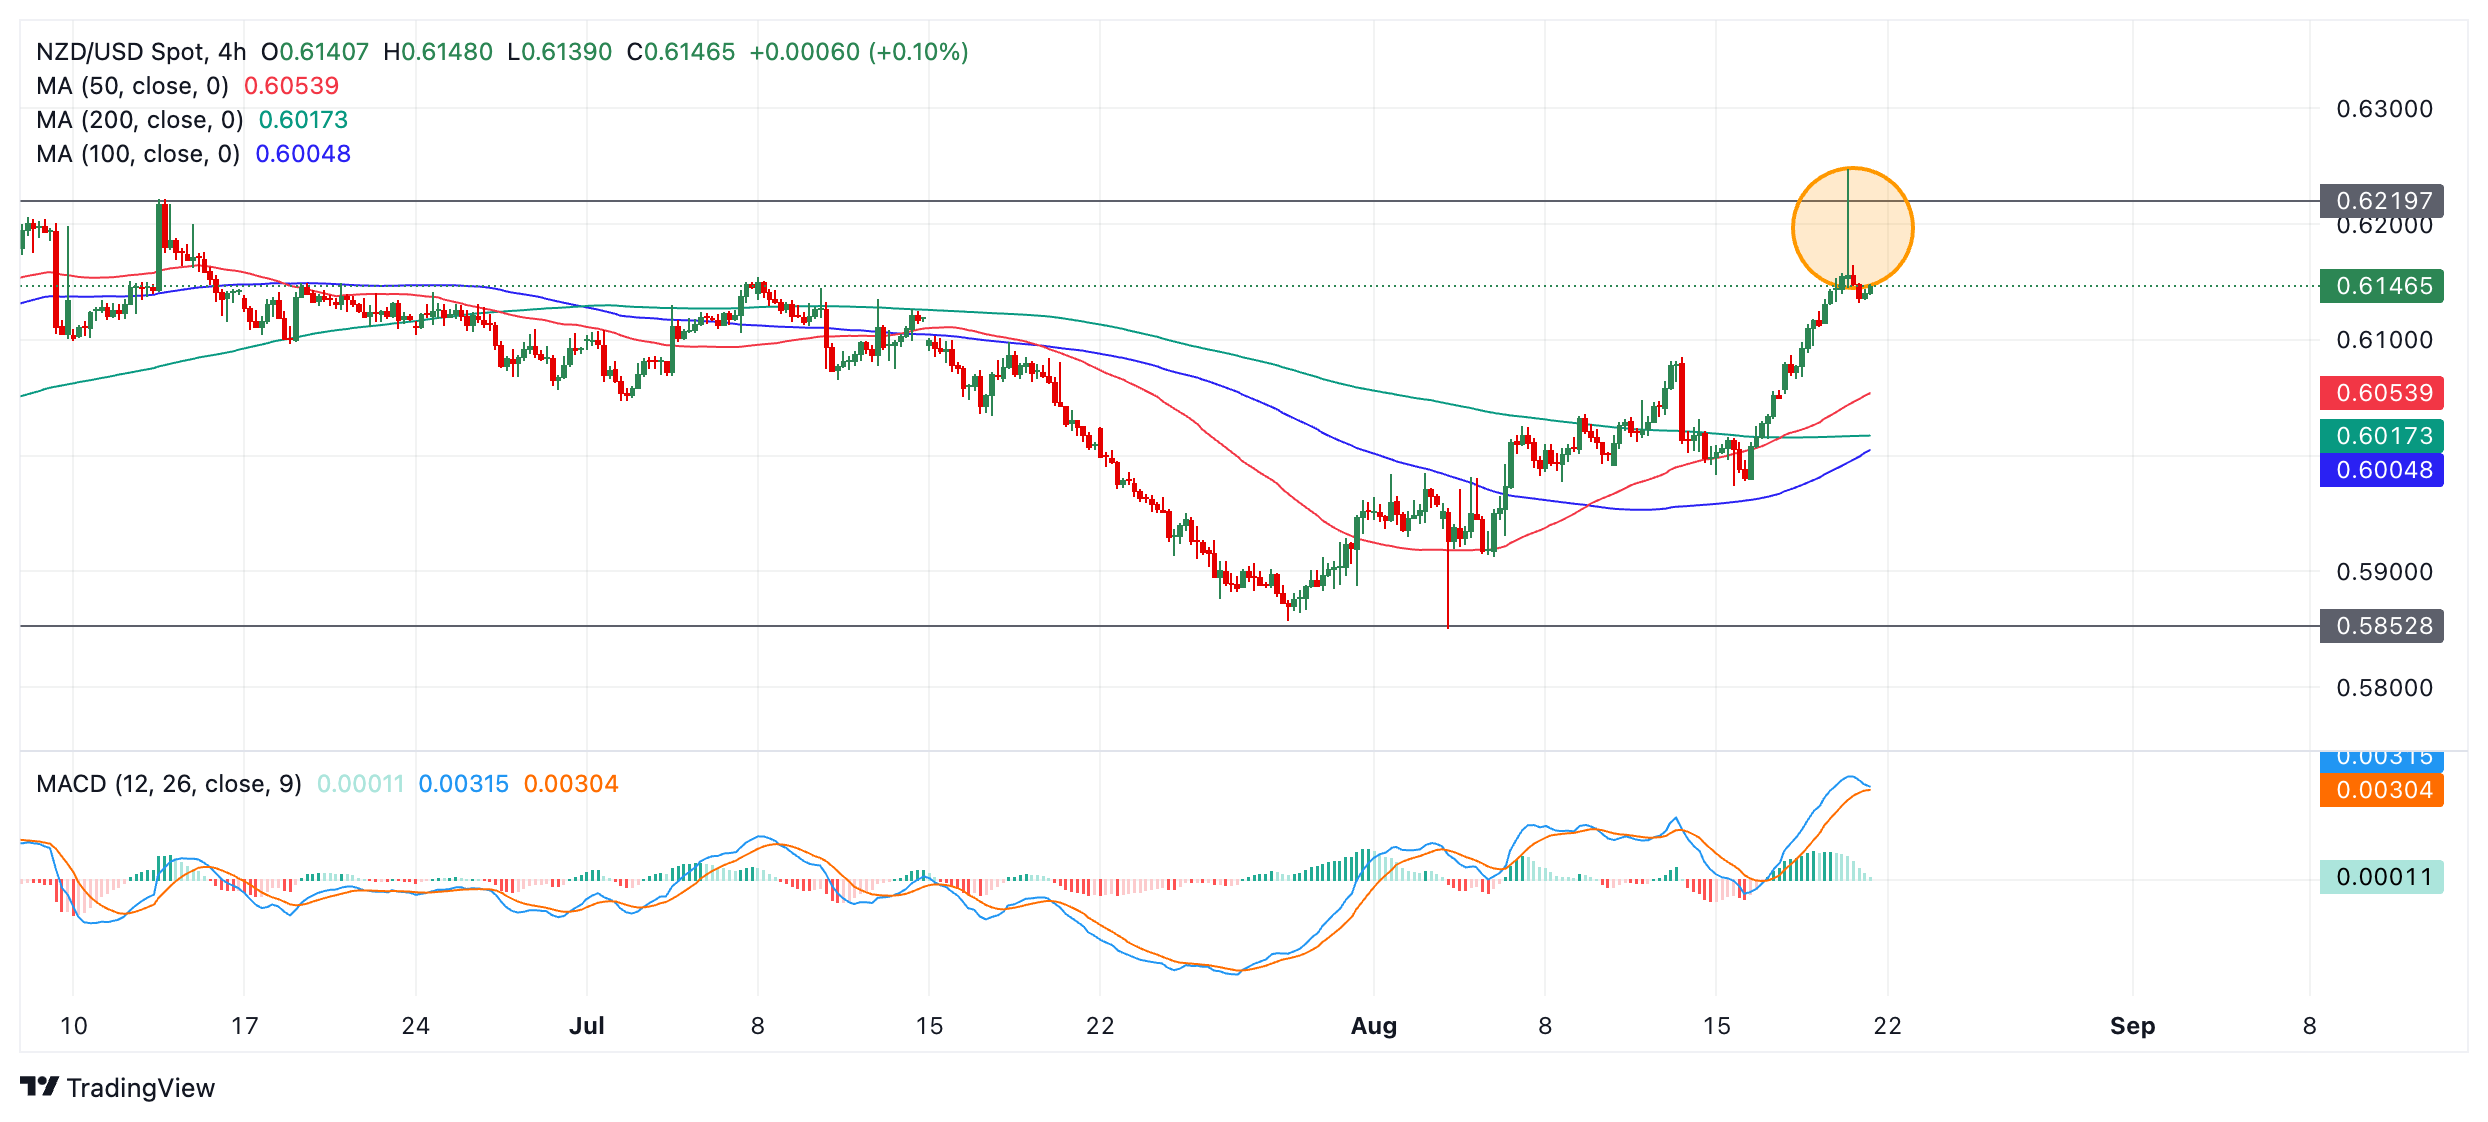
Forming as it did at the top of the range, the Gravestone Doji suggests a move back down towards the range lows of around 0.5852 is on the horizon. A close below 0.6130 would provide added confirmation of more downside.
The Moving Average Convergence Divergence (MACD) line has nearly crossed below the red signal line. If it does – which looks likely – it will provide further bearish confirmation.
Author

Joaquin Monfort
FXStreet
Joaquin Monfort is a financial writer and analyst with over 10 years experience writing about financial markets and alt data. He holds a degree in Anthropology from London University and a Diploma in Technical analysis.


