|

NZD/USD Price Analysis: Drops back towards 200-EMA around 0.6250, buyers stay hopeful

  • NZD/USD remains depressed around intraday low as it snaps two-day winning streak.
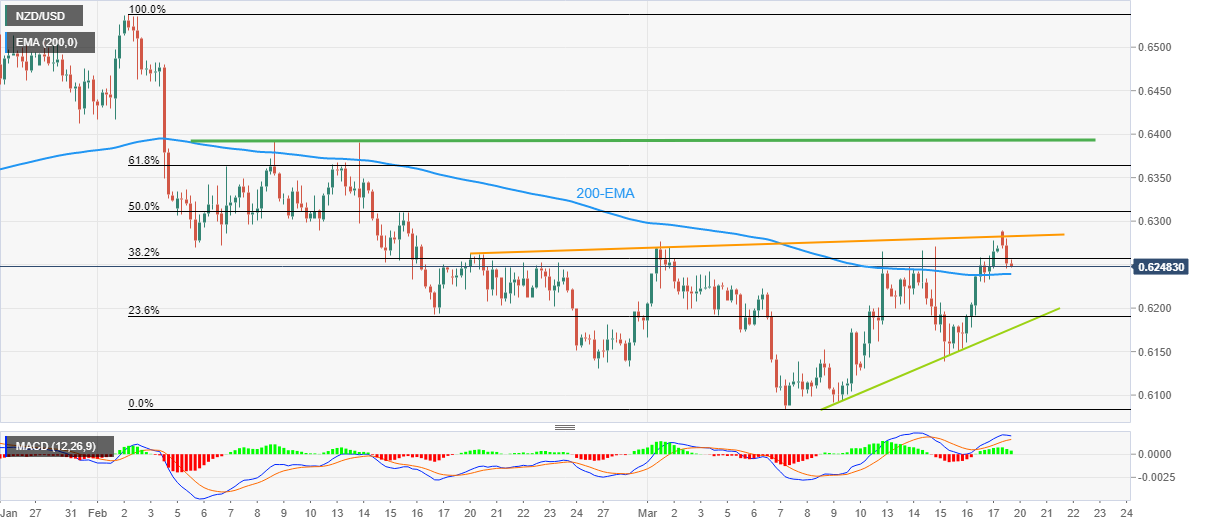
  • Bullish MACD signals, 200-EMA and nearby rising trend line keeps buyers hopeful unless breaking 0.6180 support.
  • One-month-old ascending resistance line challenges Kiwi pair’s immediate upside.

NZD/USD prints the first daily loss in three as bears flirt with the 0.6250 level heading into Monday’s European session. In doing so, the Kiwi pair reverses from an upward-sloping resistance line from late February while dropping toward the 200-bar Exponential Moving Average (EMA).

Even if the one-month-long ascending trend line resistance challenges NZD/USD bulls near 0.6285, the pair’s sustained trading beyond the key EMA joins the bullish MACD signals to keep buyers hopeful.

That said, a one-week-old upward-sloping support line, close to 0.6175 at the latest, also restricts the short-term downside of the NZD/USD pair, in addition to the 200-EMA level surrounding 0.6240.

In a case where the Kiwi pair drops below 0.6175, the odds of witnessing a slump toward the monthly low near 0.6085 can’t be ruled out.

On the flip side, a clear upside break of the stated resistance line, near 0.6285 at the latest, will need validation from the 0.6300 round figure to propel the quote towards the tops marked during early February near 0.6390.

Following that, a run-up toward the Year-To-Date (YTD) high of nearly 0.6540 can’t be ruled out.

To sum up, NZD/USD remains on the bull’s radar despite the latest failure to cross the short-term resistance line.

NZD/USD: Four-hour chart

Trend: Further upside expected

Additional important levels

Overview
Today last price0.625
Today Daily Change-0.0019
Today Daily Change %-0.30%
Today daily open0.6269
 
Trends
Daily SMA200.6194
Daily SMA500.6313
Daily SMA1000.6263
Daily SMA2000.6162
 
Levels
Previous Daily High0.6278
Previous Daily Low0.6178
Previous Weekly High0.6278
Previous Weekly Low0.6131
Previous Monthly High0.6538
Previous Monthly Low0.6131
Daily Fibonacci 38.2%0.624
Daily Fibonacci 61.8%0.6216
Daily Pivot Point S10.6205
Daily Pivot Point S20.6141
Daily Pivot Point S30.6105
Daily Pivot Point R10.6305
Daily Pivot Point R20.6342
Daily Pivot Point R30.6406

Author

Anil Panchal

Anil Panchal

FXStreet

Anil Panchal has nearly 15 years of experience in tracking financial markets. With a keen interest in macroeconomics, Anil aptly tracks global news/updates and stays well-informed about the global financial moves and their implications.

More from Anil Panchal
Share:

Markets move fast. We move first.

Orange Juice Newsletter brings you expert driven insights - not headlines. Every day on your inbox.

By subscribing you agree to our Terms and conditions.

Editor's Picks

EUR/USD stays bid above 1.1700 as risk flows dominate

EUR/USD posts small gains above 1.1700 in early European trading hours on Monday. The US Dollar remains broadly subdued amid a risk-on market profile, underpinning the pair. 

GBP/USD clings to recovery gains near 1.3400

GBP/USD is clinging to recovery gains near 1.3400 in early Europe on Monday. The pair capitalizes on an upbeat market mood and a steady US Dollar as traders digest the recent

 monetary policy decisions by the Fed and the BoE.

Gold hits fresh record highs above $4,400 amid renewed geopolitical woes

Gold is hitting fresh record highs above $4,400 early Monday, helped by renewed geopolitical tensions. Israel-Iran conflict and US-Venezuela headlines drive investors toward the traditional store of value, Gold. 

Bitcoin, Ethereum and Ripple eye breakout for fresh recovery

Bitcoin, Ethereum, and Ripple are approaching key technical levels at the time of writing on Monday as the broader crypto market stabilizes. Market participants are closely watching whether BTC, ETH, and XRP can sustain breakouts and achieve decisive daily closes above nearby resistance levels, which could signal the start of a short-term recovery.

Ten questions that matter going into 2026

2026 may be less about a neat “base case” and more about a regime shift—the market can reprice what matters most (growth, inflation, fiscal, geopolitics, concentration). The biggest trap is false comfort: the same trades can look defensive… right up until they become crowded.

Hyperliquid price forecast: Bullish interest builds amid user recovery

Hyperliquid (HYPE) trades at $25 at press time on Monday, holding the 3% gains from the previous day. The perpetual exchange sees a recovery in active users, while weekly fees collected decline to the lowest level so far this month.