NZD/USD Price Analysis: Bulls struggle with 20-day SMA resistance


  • NZD/USD loses momentum, gets rejected by the 20-day SMA.
  • Bulls struggle to claim control and get stuck in the 0.6070-0.6100 channel.
  • Indicators paint a neutral to bearish picture on the daily chart.

In Monday's trading session, the NZD/USD showed weakened momentum, declining by 0.60% to 0.6080. Buyers found the 20-day Simple Moving Average (SMA) at around 0.6100, a strong resistance that quickly rejected the bullish force.

Daily technical indicators reflect a cautionary scenario for bullish traders. The Relative Strength Index (RSI) is currently at 46, a decrease from above 50 levels and now placing it in negative zone. This dip represents a decrease in buying pressure. On the contrary, the Moving Average Convergence Divergence (MACD) presents flat red bars, suggesting a somewhat stagnant bearish momentum.

NZD/USD daily chart

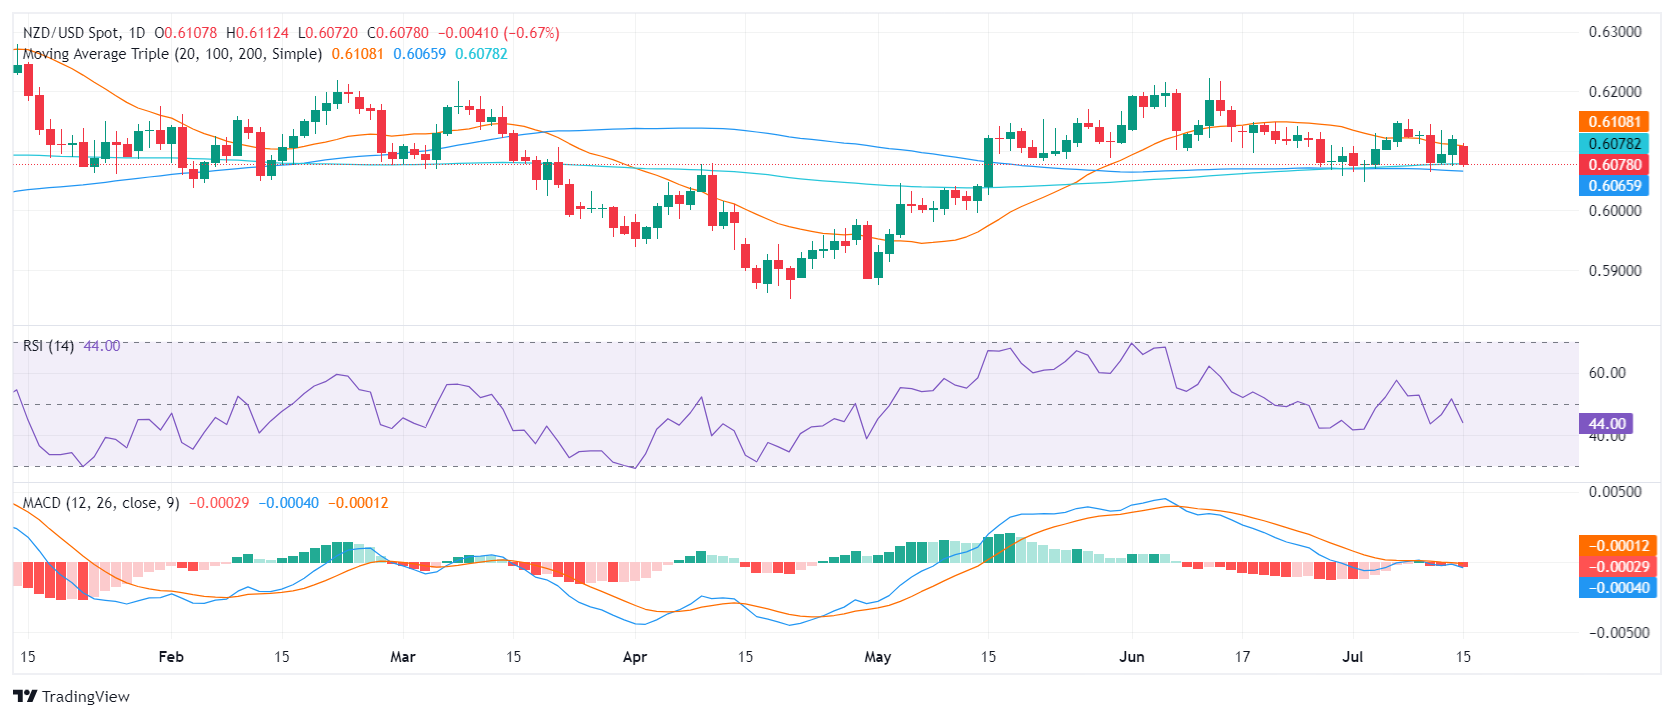
The bulls have got their work cut out as they face resistance at 0.6100 around the 20-day SMA, followed by the higher barriers at 0.6150 and 0.6200. A convincing close above these levels would be necessary to enforce bullish control and steer the focus northwards.

On the flip side, the 0.6070 mark acts as a staunch support, holding the line in the face of downward pressure, being closely trailed by further support lines at 0.6050 and 0.6030. A decisive plunge below these levels would indicate a shift back to a bearish perspective, potentially paving the way for a correction toward even lower levels.


Share: Feed news

Information on these pages contains forward-looking statements that involve risks and uncertainties. Markets and instruments profiled on this page are for informational purposes only and should not in any way come across as a recommendation to buy or sell in these assets. You should do your own thorough research before making any investment decisions. FXStreet does not in any way guarantee that this information is free from mistakes, errors, or material misstatements. It also does not guarantee that this information is of a timely nature. Investing in Open Markets involves a great deal of risk, including the loss of all or a portion of your investment, as well as emotional distress. All risks, losses and costs associated with investing, including total loss of principal, are your responsibility. The views and opinions expressed in this article are those of the authors and do not necessarily reflect the official policy or position of FXStreet nor its advertisers. The author will not be held responsible for information that is found at the end of links posted on this page.

If not otherwise explicitly mentioned in the body of the article, at the time of writing, the author has no position in any stock mentioned in this article and no business relationship with any company mentioned. The author has not received compensation for writing this article, other than from FXStreet.

FXStreet and the author do not provide personalized recommendations. The author makes no representations as to the accuracy, completeness, or suitability of this information. FXStreet and the author will not be liable for any errors, omissions or any losses, injuries or damages arising from this information and its display or use. Errors and omissions excepted.

The author and FXStreet are not registered investment advisors and nothing in this article is intended to be investment advice.

Recommended content


Recommended content

Editors’ Picks

EUR/USD tumbles toward 1.1450 as geopolitical tensions escalate

EUR/USD tumbles toward 1.1450 as geopolitical tensions escalate

EUR/USD stays under bearish pressure and falls toward 1.1450 on Monday. The renewed US Dollar buying, amid the deepening crisis in the Middle East, and mixed PMI data releases from Germany and the Eurozone weigh on the pair as focus shifts to US data and central bank talks.

Could Iran block the Strait of Hormuz? Why Oil is on edge after US strikes

Could Iran block the Strait of Hormuz? Why Oil is on edge after US strikes

As the Israel-Iran conflict reaches new heights, an old threat is coming back to haunt the markets: that of the closure of the Strait of Hormuz. This narrow arm of the sea in the Persian Gulf, wedged between Iran to the north and the United Arab Emirates and Oman to the south, is much more than a simple sea passage.

Gold stays below $3,400 on broad USD strength

Gold stays below $3,400 on broad USD strength

Gold stays on the back foot to start the week and trades below $3,400. Although XAU/USD's manages to limit its losses, the US Dollar (USD) also benefits from escalating geopolitical tensions in the Middle East, making it difficult for the pair to gather recovery momentum.

Five fundamentals for the week: World anxiously awaits Iran's response

Five fundamentals for the week: World anxiously awaits Iran's response Premium

The Middle East remains in the spotlight after a turbulent weekend. Fed Chair Jerome Powell faces lawmakers and may shed more light on the central bank's thinking, and a key inflation figure is expected later to promise a strong end to the week.

GBP/USD holds recovery above 1.3400, with eyes on UK PMI, Middle East woes

GBP/USD holds recovery above 1.3400, with eyes on UK PMI, Middle East woes

GBP/USD is holding its rebound above 1.3400 in the European session on Monday. The fears that Iran would retaliate against US attacks on its nuclear sites continue to support the safe-haven US Dollar. Investors await the June preliminary PMI readings from the UK and the US for fresh trading directives. 

The Best brokers to trade EUR/USD

The Best brokers to trade EUR/USD

SPONSORED Discover the top brokers for trading EUR/USD in 2025. Our list features brokers with competitive spreads, fast execution, and powerful platforms. Whether you're a beginner or an expert, find the right partner to navigate the dynamic Forex market.

Forex MAJORS

Cryptocurrencies

Signatures

Best Brokers of 2025