|

NZD/USD Price Analysis: Bulls struggle to hold gains, Kiwi outlook turns negative

  • Kiwi tallies a three-day losing streak, end the week on a negative note with the pair stabilizing at 0.6115.
  • NZD/USD outlook continues to skew bearish as bulls fail to maintain upward traction.
  • Bucking the bearish trend, a break above 0.6150, the position of the 20-day SMA, is vital.

On Friday, the NZD/USD extended its losing streak to three days. Despite an attempt to rally which took the pair to a high of 0.6140, the bulls were unable to return to the positive side and the pair stabilized at 0.6115 The unsuccessful attempt to maintain gains solidifies the increasing bearish sentiment for the Kiwi. The currency pair must climb past the 20-day Simple Moving Average (SMA) situated at 0.6150 to brighten the otherwise negative outlook.

The Relative Strength Index (RSI) for the NZD/USD pair on the daily chart locates at 49, hinting at a shift of momentum towards more bearishness. Despite this downward shift, the RSI remains near the neutral zone. Furthermore, the Moving Average Convergence Divergence (MACD) continues to increase its red bars, indicating an amplified seller presence in the market.

NZD/USD daily chart

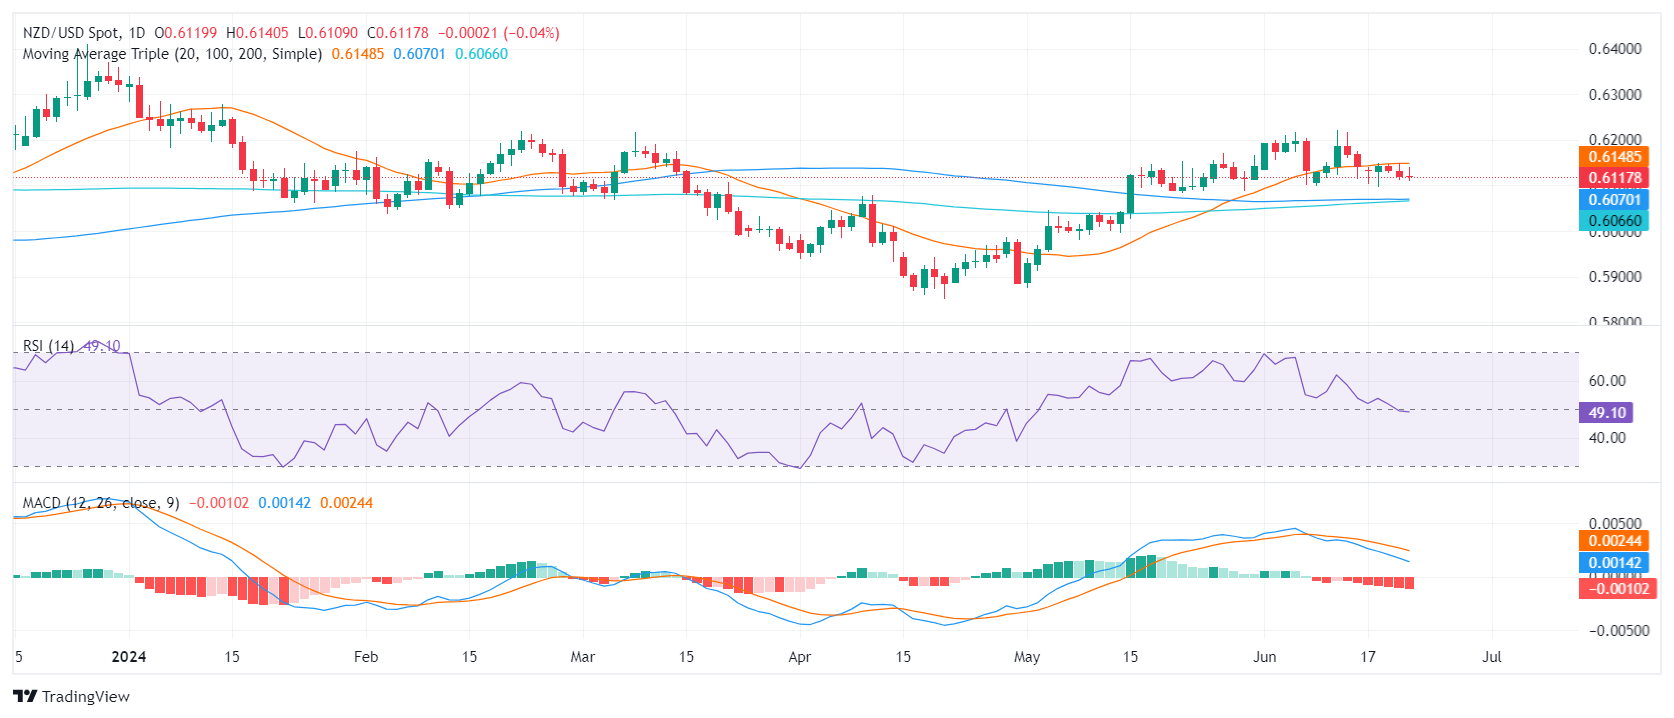
The NZD/USD finds immediate support near the 0.6100 level. Beneath that, additional support resides at the 100-day SMA at 0.6070 and the 200-day SMA at 0.6060. These levels could offer a robust defense should the pair extend its downside. A breach below these SMA convergence points might signal an intensifying sell-off scenario.

Conversely, the first resistance remains around the 20-day SMA level at 0.6150. Higher resistances are found at the 0.6170 and 0.6200 levels. A decisive breakout above these levels could possibly indicate an end to the current bearish market sentiment and start to favor the bulls.

NZD/USD

Overview
Today last price0.6118
Today Daily Change-0.0002
Today Daily Change %-0.03
Today daily open0.612
 
Trends
Daily SMA200.6148
Daily SMA500.6055
Daily SMA1000.607
Daily SMA2000.6065
 
Levels
Previous Daily High0.6149
Previous Daily Low0.6111
Previous Weekly High0.6222
Previous Weekly Low0.6099
Previous Monthly High0.6171
Previous Monthly Low0.5875
Daily Fibonacci 38.2%0.6126
Daily Fibonacci 61.8%0.6134
Daily Pivot Point S10.6104
Daily Pivot Point S20.6089
Daily Pivot Point S30.6066
Daily Pivot Point R10.6142
Daily Pivot Point R20.6165
Daily Pivot Point R30.618

Author

Patricio Martín

Patricio is an economist from Argentina passionate about global finance and understanding the daily movements of the markets.

More from Patricio Martín
Share:

Editor's Picks

EUR/USD keeps the offered stance just above 1.1700

EUR/USD is coming under heavy selling pressure in what has been a rather grim start to the new trading week, with the pair now trading close to the 1.1700 support area as the US Dollar stages a solid rebound. The prevailing flight to safety mood continues to favour the Greenback, as investors react to the escalating conflict in the Middle East and trim risk exposure across the board.

GBP/USD hits new yearly lows near 1.3300

GBP/USD adds to the recent bearish tone, approaching to the key 1.3300 support to reach fresh YTD troughs against the backdrop of the robust performance of the US Dollar. Indeed, Cable’s decline comes amid the firm demand for the safe-haven space in the wake of the US and Israel attacks to Iran.

Gold trims losses, back below $5,400

Gold now surrenders part of the earlier advance past the $5,400 mark per troy ounce at the beginning of the week. Indeed, the precious metal’s strong uptick remains fuelled by increasing geopolitical tensions in the Middle East amid the intense demand for safer assets.

Bitcoin on brink of breakdown amid US-Iran war

Bitcoin (BTC) remains under pressure near the key support level of $65,700. Trading at $66,400 at the time of writing on Monday, a breakdown below this critical level would suggest a deeper correction ahead.

The Fed is finally talking about AI – Here's why it matters for the US Dollar

AI is moving from earnings calls into the heart of monetary policy discussions, forcing Federal Reserve officials to confront a new question: How to act if AI reshapes inflation, employment and interest rates at the same time?

Pi Network Price Forecast: Core team offloads supply, weighing on PI recovery

Pi Network  hovers below $0.1700, broadly steady at press time on Monday, attempting a recovery after a 2% loss the previous day. Sunday’s decline aligned with nearly 49 million PI tokens offloaded by the Pi Foundation, implying a spike in supply pressure that capped the prevailing four-day recovery.