|

NZD/USD Price Analysis: Bulls falter after breaking 20-day SMA, bullish thesis at risk

  • NZD/USD sank by 0.69% on Monday to trade near 0.5885.
  • Bulls failed to secure the 20-day SMA after breaking above it, risking the bullish bias.
  • Indicators took a step back and might continue losing ground if they do not secure the 20-day SMA.

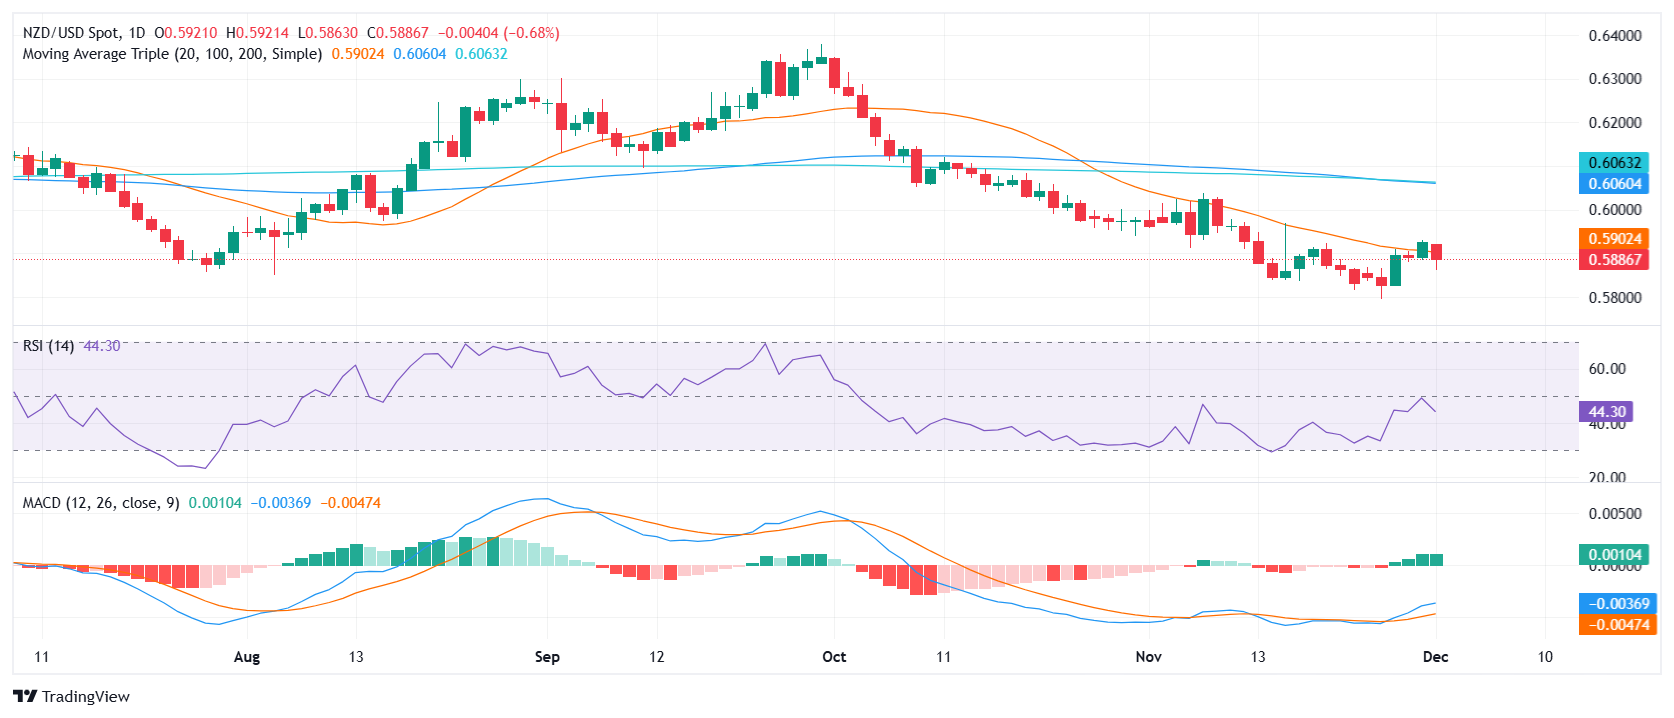
The NZD/USD pair extended its weakness from a fresh monthly high recorded in the previous week. In Monday's session, the NZD/USD declined by 0.69% to 0.5885. Bulls failed to secure the 20-day Simple Moving Average (SMA) after breaking above it, risking the bullish bias.

Technical analysis of the NZD/USD pair indicates a sideways range, with the Relative Strength Index (RSI) at 46, suggesting rising selling pressure, while the Moving Average Convergence Divergence (MACD) is flat and green, indicating flat buying pressure. Overall, the outlook is mixed, with support levels at 0.5850, 0.5800, and 0.5750, and resistance levels at 0.5900, 0.5950, and 0.6000.

Technical indicators for the NZD/USD pair have taken a step back, signaling a potential shift in momentum. While the pair remains within a range, the failure of bulls to hold above the 20-day SMA poses a risk to the bullish bias. Traders should monitor the mentioned levels as a loss of the 0.5850 area could indicate a continuation of the downtrend.

NZD/USD daily chart

Author

Patricio Martín

Patricio is an economist from Argentina passionate about global finance and understanding the daily movements of the markets.

More from Patricio Martín
Share:

Editor's Picks

AUD/USD regains mild traction, falters near 0.7150

AUD/USD gathers some steam and manages to flirt with the 0.7150 level on Thursday. However, the pair has retraced some of Wednesday’s significant pullback due to renewed selling pressure on the Greenback and a slight improvement in risk sentiment following hopes of a deal in the Middle East. Wrapping up the Australian docket, the RBA’s Hauser will speak early on Friday.

USD/JPY trades below 160.00 intervention threshold; bullish bias intact

The USD/JPY pair attracts some sellers during the Asian session amid fears that authorities will step in again to prop up the Japanese Yen. Furthermore, the Israel-Lebanon truce prompts some profit-taking around the US Dollar and exerts downward pressure on the currency pair.

Gold puts its 200-day SMA to the test near $4,420

Gold keeps the bullish stance in place in the latter part of Thursday’s session, although a convincing break above the key $4,500 mark per troy ounce still remains elusive. The precious metal’s advance comes amid the resurgence of some selling interest around the Greenback, improving risk sentiment, and declining US Treasury yields across the board.

XRP plummets as ETF outflows, geopolitical tensions reinforce bearish outlook
Ripple (XRP) edges lower, trading around $1.15 at the time of writing on Thursday, its lowest price since February 6. The cross-border money remittance token is extending the sell-off for the fifth consecutive day, reflecting persistent headwinds from ongoing geopolitical tensions and investor uncertainty.
Nonfarm payrolls: Testing the limits of Fed policy patience

The upcoming nonfarm payrolls report for May will provide the final update on the US labor market before Kevin Warsh attends his first policy meeting as the new Fed Chair later this month.

Recession on paper: What really moves the Canadian Loonie now?

Statistics Canada handed the headline writers a gift and the analysts a headache. Real GDP shrank 0.1% on an annualized basis in the first quarter, and with the fourth quarter of 2025 revised down to a 1.0% contraction, that is two negative quarters in a row, the textbook definition of a technical recession and Canada's first since the pandemic.