|

NZD/USD Price Analysis: Bulls back off, consolidation may be incoming

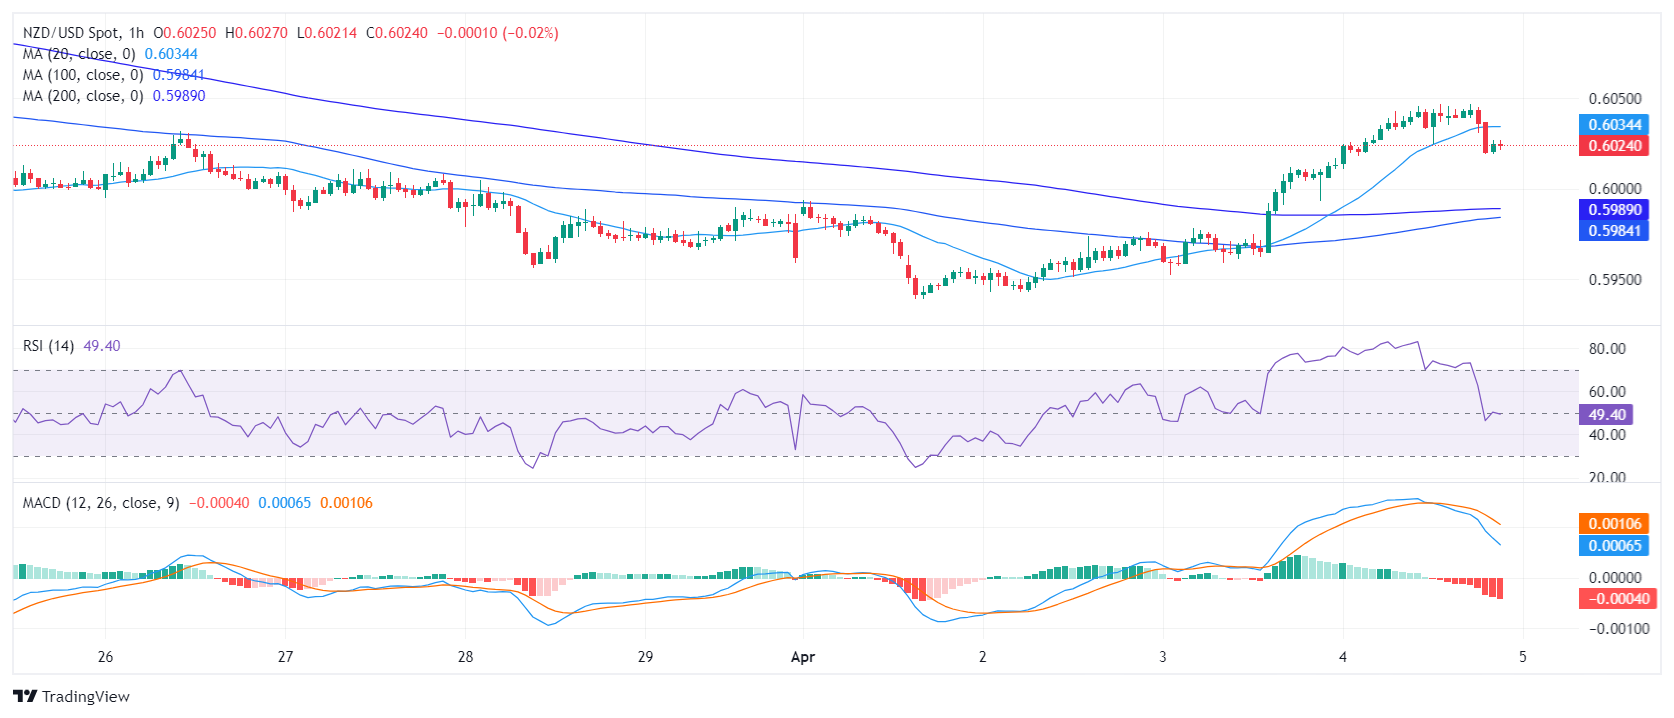
  • The hourly chart signals a possible short-term rise in selling pressure with a shar decline in the RSI.
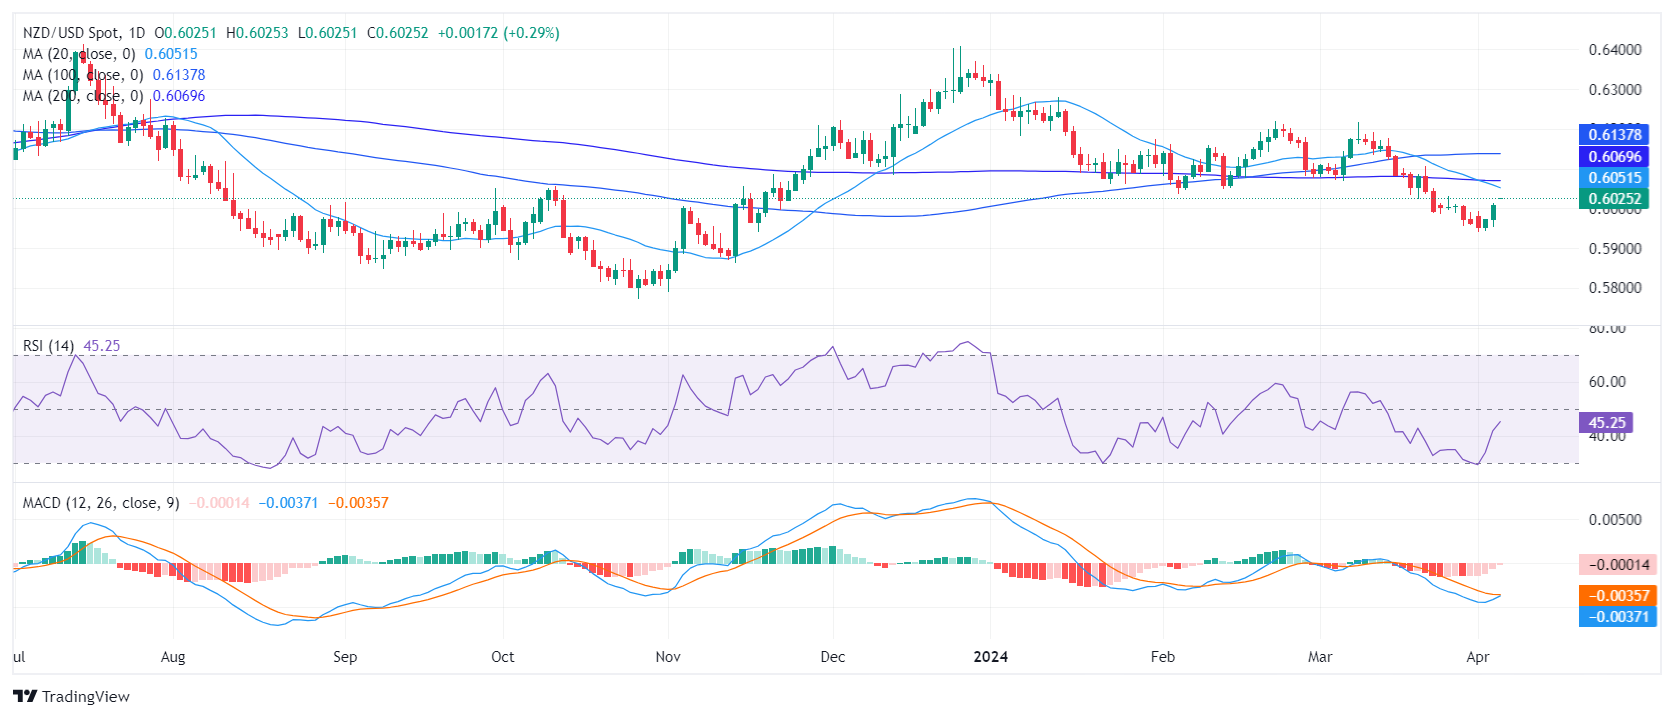
  • The negative outlook remains on the daily chart.
  • The bearish crossover between the 20 and 200-day SMAs implies a strong negative momentum.

The NZD/USD pair is trading at around 0.6025 and trimmed most of its daily gains on Thursday. After getting rejected by the 20-day Simple Moving Average (SMA) the latest upwards movements seem to have been short-lived and didn’t present a battle to the bearish overall trend.

On the daily chart, the Relative Strength Index (RSI) has shown slow movement from negative to positive territory over past sessions and now resides at around 47.15. However, the flat red bars of the Moving Average Convergence Divergence (MACD) indicate a steady negative momentum.

NZD/USD daily chart

On the hourly chart, the RSI proved more erratic, reaching a positive value of 70 earlier in the session and dropping to 50. This fluctuation suggests a possible short-term shift in momentum favoring the sellers. The MACD, continues to print red flat bars, indicating sustained negative momentum throughout recent hours.

NZD/USD hourly chart

Concerning its Simple Moving Averages (SMAs), the NZD/USD is below the 20,100 and 200-day SMAs. Thursday’s 20-day SMA rejection adds further arguments that the bullish momentum is weak. Moreover, the mentioned average completed a bearish crossover with the 200-day SMA which may eventually limit any upward momentum.

NZD/USD

Overview
Today last price0.6025
Today Daily Change0.0017
Today Daily Change %0.28
Today daily open0.6008
 
Trends
Daily SMA200.6059
Daily SMA500.6096
Daily SMA1000.6137
Daily SMA2000.607
 
Levels
Previous Daily High0.6012
Previous Daily Low0.5952
Previous Weekly High0.6032
Previous Weekly Low0.5956
Previous Monthly High0.6218
Previous Monthly Low0.5956
Daily Fibonacci 38.2%0.5989
Daily Fibonacci 61.8%0.5975
Daily Pivot Point S10.5969
Daily Pivot Point S20.5931
Daily Pivot Point S30.5909
Daily Pivot Point R10.6029
Daily Pivot Point R20.6051
Daily Pivot Point R30.6089

Author

Patricio Martín

Patricio is an economist from Argentina passionate about global finance and understanding the daily movements of the markets.

More from Patricio Martín
Share:

Editor's Picks

AUD/USD eyes 0.7150 barrier nine-day EMA

AUD/USD inches higher after registering modest losses in the previous day, trading around 0.7130 during the Asian hours. The technical analysis of the daily chart indicates that the pair is moving sideways within the rectangle pattern, suggesting a consolidation as neither the bulls nor the bears have enough momentum to take control of the market.

USD/JPY trades below 160.00 intervention threshold; bullish bias intact

The USD/JPY pair attracts some sellers during the Asian session amid fears that authorities will step in again to prop up the Japanese Yen. Furthermore, the Israel-Lebanon truce prompts some profit-taking around the US Dollar and exerts downward pressure on the currency pair.

Gold extends rebound to $4,500 as US yields edge lower

Gold (XAU/USD) preserves its recovery momentum following Wednesday's slide and tests the $4,500 mark in the second half of the day on Thursday. While US-Iran uncertainty remains, easing tensions between Lebanon on Israel seems to be helping the market mood improve, causing the USD to lose strength alongside falling US T-bond yields and opening the door for a decisive rebound in XAU/USD.

Hyperliquid: ETF demand, capital rotation fuel HYPE rally as Bitcoin melts

Hyperliquid price sustains an upward trend near its all-time high of $75.76 on Thursday after posting 80% gains in May, while Bitcoin (BTC) retraces below $65,000, triggering a market-wide panic.

Nonfarm payrolls: Testing the limits of Fed policy patience

The upcoming nonfarm payrolls report for May will provide the final update on the US labor market before Kevin Warsh attends his first policy meeting as the new Fed Chair later this month.

Recession on paper: What really moves the Canadian Loonie now?

Statistics Canada handed the headline writers a gift and the analysts a headache. Real GDP shrank 0.1% on an annualized basis in the first quarter, and with the fourth quarter of 2025 revised down to a 1.0% contraction, that is two negative quarters in a row, the textbook definition of a technical recession and Canada's first since the pandemic.