|

NZD/USD Price Analysis: Bulls approach 0.5700 hurdle despite mixed China inflation

  • NZD/USD takes the bids to extend the previous day’s rebound from 31-month low.
  • China’s CPI rose to 2.8% YoY but PPI eased to 0.9% during September.
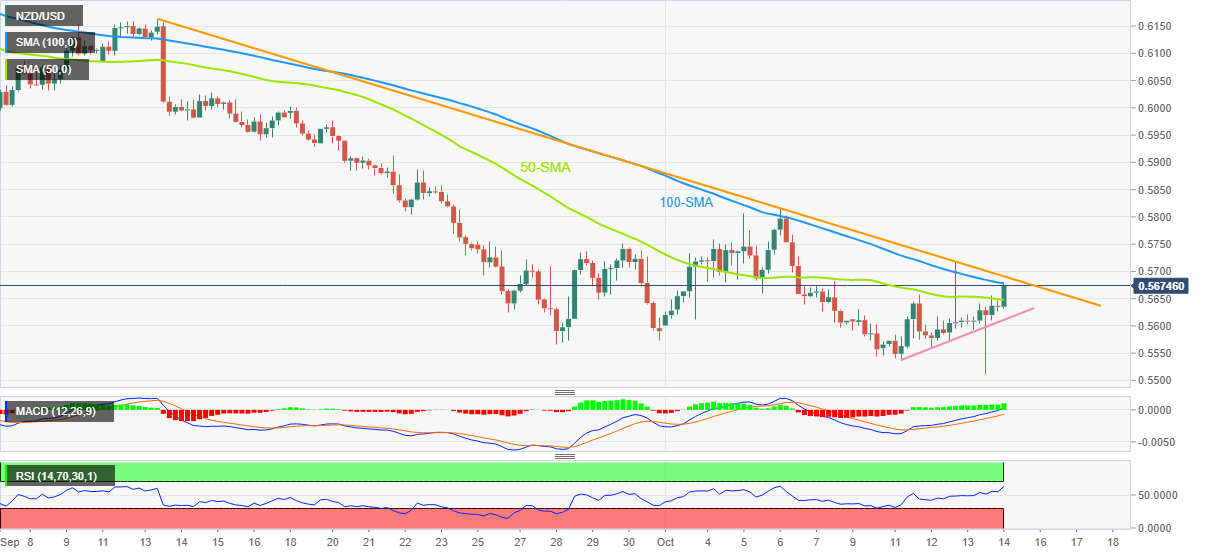
  • Sustained break of 50-SMA, firmer oscillators favor buyers to cross the monthly resistance line.
  • Sellers may not risk entries beyond four-day-old support line.

NZD/USD renews an intraday high around 0.5680 as bulls cheer a jump in China’s Consumer Price Index (CPI) during early Friday. Even so, the 100-SMA challenges the previous day’s recovery from a 2.5-year low.

That said, China’s headline Consumer Price Index (CPI) matched upbeat market forecasts by rising 2.8% in September while the Producer Price Index (PPI) fell short of meeting expectations during the stated month, down to 0.9% versus 1.0% forecasts and 2.3% prior.

It’s worth noting that the Kiwi pair’s successful break of the 50-SMA joins bullish MACD signals and firmer RSI (14), not overbought, to keep buyers hopeful.

However, a clear upside break of the one-month-old descending resistance line, around 0.5690 by the press time, appears necessary for the NZD/USD bull’s conviction. Following that, the monthly high of 0.5815 will be in focus.

Alternatively, pullback moves may initially aim for the 50-SMA support near 0.5645, a break of which could direct the quote toward an upward-sloping support line from Tuesday, close to 0.5610 at the latest.

In a case where the NZD/USD prices break 0.5610 support, the odds of witnessing a slump towards the fresh yearly low, around 0.5510 of late, can’t be ruled out.

NZD/USD: Four-hour chart

Trend: Further upside expected

Additional important levels

Overview
Today last price0.5669
Today Daily Change0.0034
Today Daily Change %0.60%
Today daily open0.5635
 
Trends
Daily SMA200.5726
Daily SMA500.6002
Daily SMA1000.6148
Daily SMA2000.6421
 
Levels
Previous Daily High0.5655
Previous Daily Low0.5512
Previous Weekly High0.5815
Previous Weekly Low0.5597
Previous Monthly High0.6162
Previous Monthly Low0.5565
Daily Fibonacci 38.2%0.56
Daily Fibonacci 61.8%0.5567
Daily Pivot Point S10.5546
Daily Pivot Point S20.5457
Daily Pivot Point S30.5403
Daily Pivot Point R10.5689
Daily Pivot Point R20.5744
Daily Pivot Point R30.5833

Author

Anil Panchal

Anil Panchal

FXStreet

Anil Panchal has nearly 15 years of experience in tracking financial markets. With a keen interest in macroeconomics, Anil aptly tracks global news/updates and stays well-informed about the global financial moves and their implications.

More from Anil Panchal
Share:

Editor's Picks

AUD/USD looks weaker, focus is back to 0.7100

AUD/USD reverses Tuesday’s gains and retreats markedly toward four-day troughs in the low 0.7100s ahead of the opening bell in Asia. The firmer tone in the Greenback weighs on the risk complex amid unabated tensions on the US-Iran front, prompting the Aussie to shed part of recent gains and refocus on the downside. Moving forward, Australian trade balance results should entertain investors early on Thursday.

Japanese Yen bounces up from lows after Japan PM Takaichi’s intervention warnings

The Japanese Yen bounced up from five-week lows against the US Dollar, turning positive on the daily chart, as Japan’s Prime Minister Sanae Takaichi warned that Tokyo is ready to take action against Yen weakness. The USD/JPY pair has pulled back from the 160.00 level, considered a line in the sand for Japanese authorities, to hit session lows at 159.55.

Gold remains under bearish pressure, looks at $4,400

Gold keeps the offered stance well in place, retreating toward the $4,430 region per troy ounce, or four-day lows, on Wednesday. The yellow metal’s retracement comes in response to escalating tensions in the Middle East, which in turn continue to drive oil prices higher while reinforcing the idea of a tighter-for-longer Fed.


XRP eyes rebound despite muted ETF demand
Ripple (XRP) rebounds above $1.23 from support at $1.20 at the time of writing on Wednesday, as the broader cryptocurrency market pares losses triggered by escalating tensions in the Middle East. Appetite for risk assets remains generally low as the United States (US) and Iran exchange fire amid a fragile ceasefire and peace negotiations.
The upside-down math of debt
In 2010, Professors Carmen Reinhart and Kenneth Rogoff published a paper, Growth in a Time of Debt, which instantly went viral. The main thesis of the paper was that once a government's debt-to-GDP ratio crosses above 90%, a financial crisis and default are around the corner.
Recession on paper: What really moves the Canadian Loonie now?

Statistics Canada handed the headline writers a gift and the analysts a headache. Real GDP shrank 0.1% on an annualized basis in the first quarter, and with the fourth quarter of 2025 revised down to a 1.0% contraction, that is two negative quarters in a row, the textbook definition of a technical recession and Canada's first since the pandemic.