|

NZD/USD Price Analysis: Bullish momentum picks up, buyers rejected at the 100-day SMA

  • The daily indicators hint at a strengthening bullish momentum.
  • Hourly indicators are consolidating after hitting overbought conditions earlier in the session.
  • If the buyers regain the 100-day SMA, the bearish trend will be threatened.

At the end of the week, the NZD/USD rallied to around 0.6050, up by 0.80%. Bullish momentum is picking up but the overall trend is still tilted in favor of the sellers. Further bullish validation is needed after the pair's unsuccessful attempt to cross a crucial 100-day Simple Moving Average (SMA) during Friday's session.

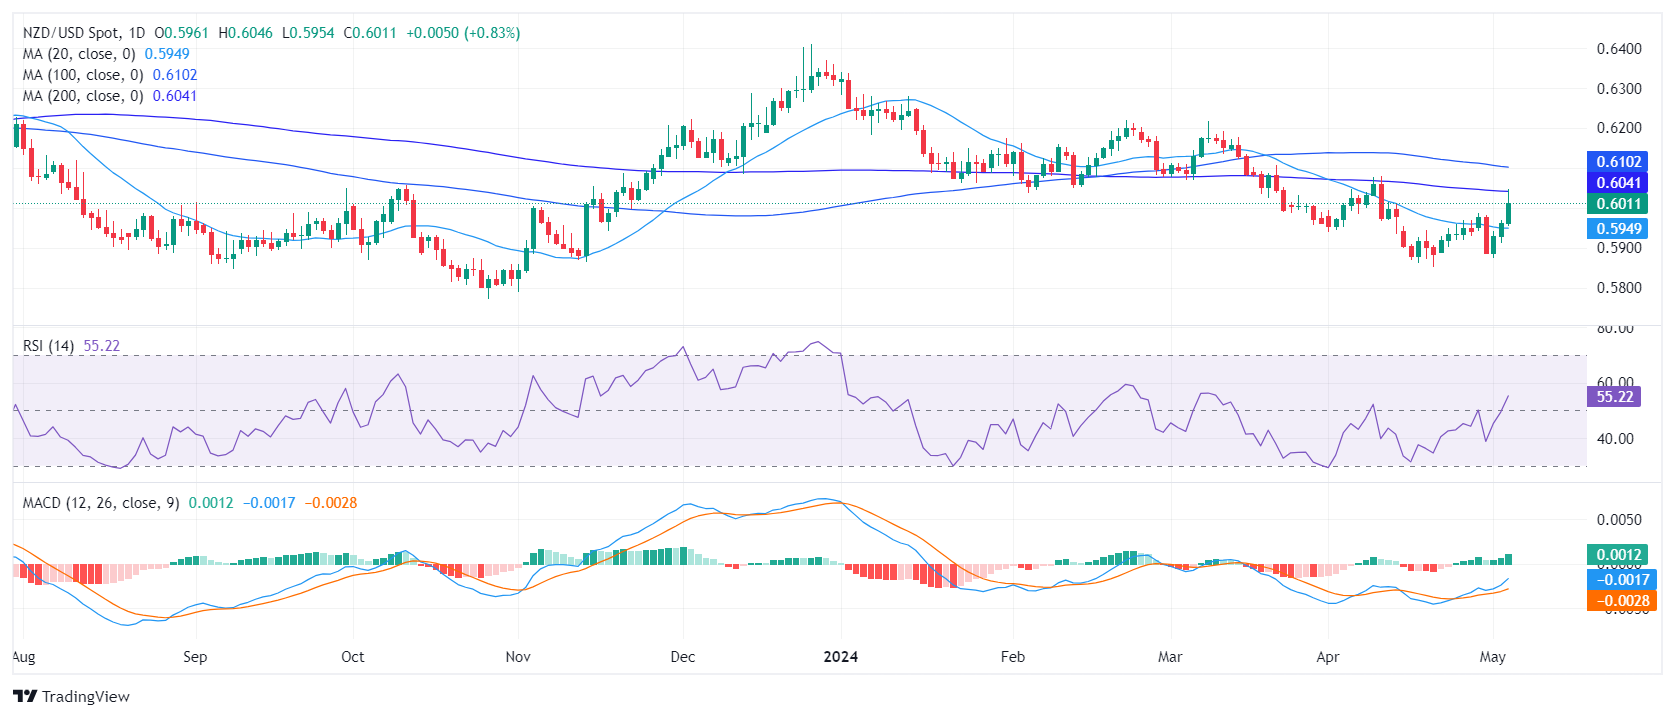
On the daily chart, the Relative Strength Index (RSI) shows a shift towards a stronger bullish trend. The last session recorded an RSI of 56, settling in positive territory. This solidifies a consistent increase in momentum in favor of buyers after being below 50 since early April.

NZD/USD daily chart

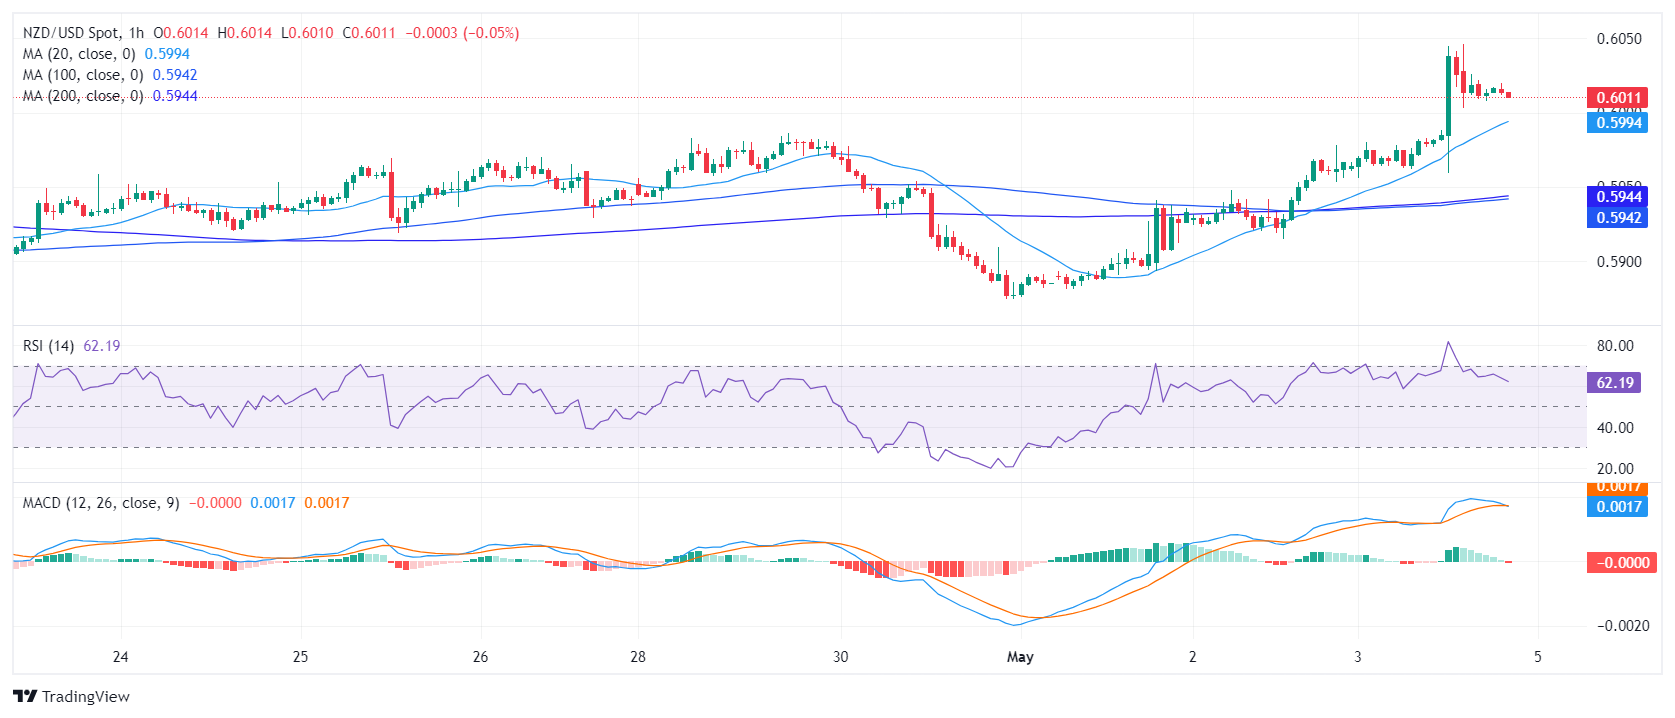
Examining the hourly chart, a similar viewpoint is observed. The RSI measures 62, but somewhat flattened after jumping above 70 earlier in the session. In addition, the Moving Average Convergence Divergence (MACD) histogram exhibited consistent red bars, signaling a potential deceleration in the bullish momentum.

NZD/USD hourly chart

Regarding the overall market trend, the NZD/USD is trading below the 100, and 200-day SMA which confirms the presence of significant downside pressure on the pair and challenges short-term buyers. Notably, the pair encountered rejection around the 100-day SMA at the 0.6100 level during Friday’s session, suggesting the buyers still need more traction to turn the outlook bullish. However, the break above the 20-day SMA definitely brightened the outlook for the short term.

NZD/USD

Overview
Today last price0.6011
Today Daily Change0.0050
Today Daily Change %0.84
Today daily open0.5961
 
Trends
Daily SMA200.5949
Daily SMA500.6026
Daily SMA1000.6104
Daily SMA2000.6042
 
Levels
Previous Daily High0.5969
Previous Daily Low0.5913
Previous Weekly High0.597
Previous Weekly Low0.5886
Previous Monthly High0.6079
Previous Monthly Low0.5851
Daily Fibonacci 38.2%0.5947
Daily Fibonacci 61.8%0.5934
Daily Pivot Point S10.5926
Daily Pivot Point S20.5891
Daily Pivot Point S30.587
Daily Pivot Point R10.5982
Daily Pivot Point R20.6004
Daily Pivot Point R30.6039

Author

Patricio Martín

Patricio is an economist from Argentina passionate about global finance and understanding the daily movements of the markets.

More from Patricio Martín
Share:

Editor's Picks

EUR/USD deflates to fresh lows, targets 1.1600

The selling pressure on EUR/USD now gathers extra pace, prompting the pair to hit fresh multi-week lows in the 1.1625-1.1620 band on Friday. The continuation of the downward bias comes in response to further gains in the US Dollar as market participants continue to assess the mixed release of US Nonfarm Payrolls in December.

GBP/USD breaks below 1.3400, challenges the 200-day SMA

GBP/USD remains under heavy fire and retreats for the fourth consecutive day on Friday. Indeed, Cable suffers the strong performance of the Greenback, intensified post-mixed NFP, and trades at shouting distance from its critical 200-day SMA near 1.3380.

Gold flirts with yearly tops around $4,500

Gold keeps its positive bias on Friday, adding to Thursday’s advance and challenging yearly highs in the $4,500 region per troy ounce. The risk-off sentiment favours the yellow metal despite the firmer tone in the Greenback and rising US Treasury yields.

Crypto Today: Bitcoin, Ethereum, XRP risk further decline as market fear persists amid slowing demand

Bitcoin holds $90,000 but stays below the 50-day EMA as institutional demand wanes. Ethereum steadies above $3,000 but remains structurally weak due to ETF outflows. XRP ETFs resume inflows, but the price struggles to gain ground above key support.

Week ahead – US CPI might challenge the geopolitics-boosted Dollar

Geopolitics may try to steal the limelight from US data. A possible US Supreme Court ruling on tariffs could dictate market movements. A crammed data calendar next week, US CPI comes on Tuesday; Fedspeak to intensify.

XRP trades under pressure amid weak retail demand

XRP presses down on the 50-day EMA support as risk-averse sentiment spreads despite a positive start to 2026. XRP faces declining retail demand, as reflected in futures Open Interest, which has fallen to $4.15 billion.