|

NZD/USD Price Analysis: Bears maintain control, eyes on 200-day SMA

  • The NZD/USD declined to 0.6095, extending its recent downtrend.
  • RSI is in negative territory and declining, while the MACD is flat and red.
  • A break below 0.6100 could open the door for a further decline towards 0.6000.

In Monday's session, the NZD/USD pair extended its recent decline, falling by 0.30% to 0.6095. The technical indicators are also bearish, suggesting that the selling pressure is likely to continue if the buyers fail to sustain the 0.6100 area where the 200-day Simple Moving Average (SMA) converges.

The Relative Strength Index (RSI) is currently at 40, which is in negative territory and declining mildly. This suggests that selling pressure is increasing slightly and that the bears are in control of the market. The Moving Average Convergence Divergence (MACD) histogram is currently flat and red, indicating a bearish outlook. As long as the RSI remains below 50 and the MACD histogram remains red, the technical outlook will remain bearish for the NZD/USD.

NZD/USD daily chart

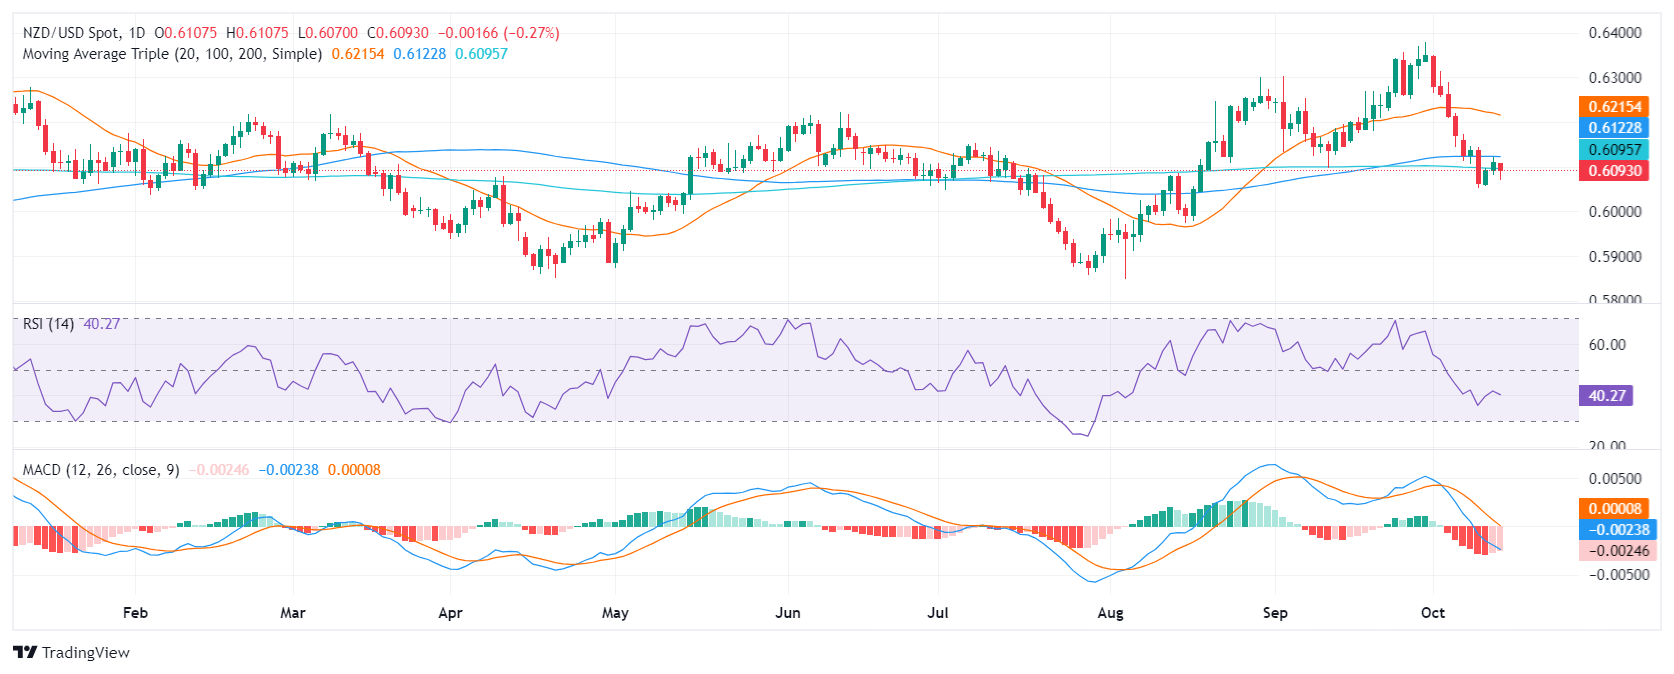
The overall outlook for the NZD/USD is bearish as the pair lost its 20-day Simple Moving Average (SMA) last week.The 200-day SMA at 0.6100 is providing some support, but a break below this level could open the door for a further decline towards 0.6000. On the upside, resistance can be seen at 0.6150 and 0.6200.

Author

Patricio Martín

Patricio is an economist from Argentina passionate about global finance and understanding the daily movements of the markets.

More from Patricio Martín
Share:

Markets move fast. We move first.

Orange Juice Newsletter brings you expert driven insights - not headlines. Every day on your inbox.

By subscribing you agree to our Terms and conditions.

Editor's Picks

EUR/USD climbs toward 1.1800 on broad USD weakness

EUR/USD gathers bullish momentum and advances toward 1.1800 in the second half of the day on Tuesday. The US Dollar weakens and helps the pair stretch higher after the employment report showed that Nonfarm Payrolls declined by 105,000 in October before rising by 64,000 in November.

GBP/USD climbs to fresh two-month high above 1.3400

GBP/USD gains traction in the American session and trades at its highest level since mid-October above 1.3430. The British Pound benefits from upbeat PMI data, while the US Dollar struggles to find demand following the mixed employment figures and weaker-than-forecast PMI prints, allowing the pair to march north.

Gold extends its consolidative phase around $4,300

Gold trades in positive above $4,300 after spending the first half of the day under bearish pressure. XAU/USD capitalizes on renewed USD weakness after the jobs report showed that the Unemployment Rate climbed to 4.6% in November and the PMI data revealed a loss of growth momentum in the private sector in December. 

US Retail Sales virtually unchanged at $732.6 billion in October

Retail Sales in the United States were virtually unchanged at $732.6 billion in October, the US Census Bureau reported on Tuesday. This print followed the 0.1% increase (revised from 0.3%) recorded in September and came in below the market expectation of +0.1%.

Ukraine-Russia in the spotlight once again

Since the start of the week, gold’s price has moved lower, but has yet to erase the gains made last week. In today’s report we intend to focus on the newest round of peace talks between Russia and Ukraine, whilst noting the release of the US Employment data later on day and end our report with an update in regards to the tensions brewing in Venezuela.

BNB Price Forecast: BNB slips below $855 as bearish on-chain signals and momentum indicators turn negative

BNB, formerly known as Binance Coin, continues to trade down around $855 at the time of writing on Tuesday, after a slight decline the previous day. Bearish sentiment further strengthens as BNB’s on-chain and derivatives data show rising retail activity.