|

NZD/USD Price Analysis: Bears approach 11-week-old support near 0.6220

  • NZD/USD holds lower ground near six-week low, prints four-day downtrend.
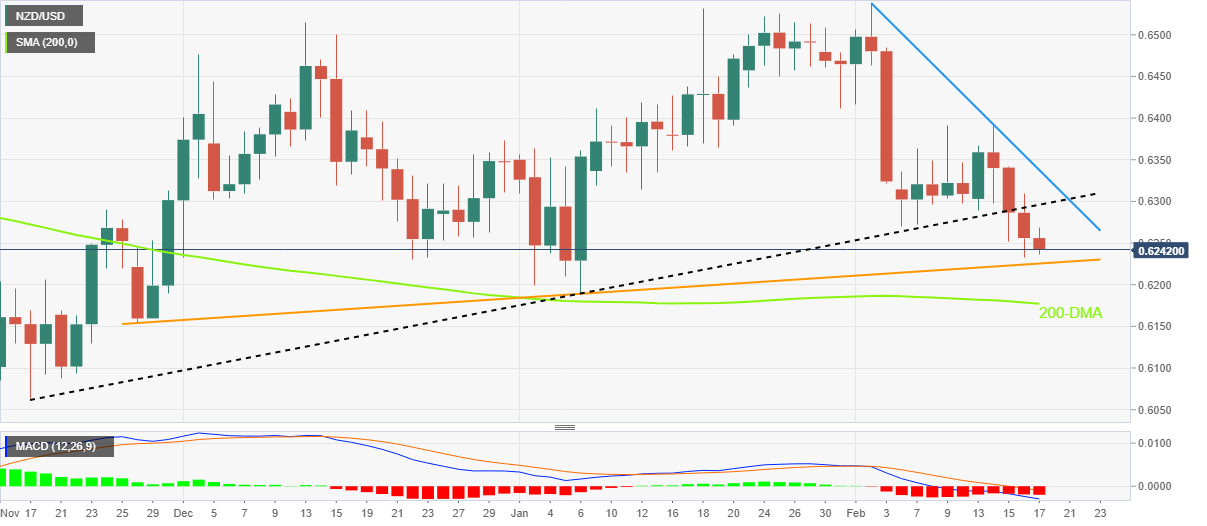
  • Clear break of three-month-old ascending trend line, bearish MACD signals favor sellers.
  • Upward-sloping support line from late November holds the key to further downside toward 200-DMA.
  • Bulls need validation from fortnight-old descending resistance line.

NZD/USD bears stay in the driver’s seat for the fourth consecutive day, down 0.23% intraday around 0.6240 during early Friday. In doing so, the Kiwi pair remains depressed near the 1.5-month low marked the previous day.

That said, the quote’s sustained downside break of the previous support line from mid-November 2022, now resistance around 0.6300, keeps the pair bears hopeful. Adding strength to the downside bias are the bearish MACD signals and the lower high formation on the daily chart.

As a result, the NZD/USD bears are well-set to battle with a 2.5-month-long support line, currently around 0.6220.

However, the quote’s further downside will need validation from the 0.6200 round figure and the 200-DMA level of 0.6177 to keep the bears in command.

Meanwhile, the previous support line from November, around 0.6300, guards the NZD/USD pair’s recovery moves.

Following that, a two-week-old descending resistance line, close to 0.6340 at the latest, will be crucial for the pair buyers to cross. Even so, the weekly high of 0.6390 and the .06400 round figure could challenge the upside momentum.

In a case where the NZD/USD remains firmer past 0.6400, the odds of witnessing a run-up toward the monthly high near 0.6540 can’t be ruled out.

NZD/USD: Daily chart

Trend: Further downside expected

Additional important levels

Overview
Today last price0.6244
Today Daily Change-0.0012
Today Daily Change %-0.19%
Today daily open0.6256
 
Trends
Daily SMA200.6398
Daily SMA500.637
Daily SMA1000.6154
Daily SMA2000.6187
 
Levels
Previous Daily High0.631
Previous Daily Low0.6232
Previous Weekly High0.6391
Previous Weekly Low0.627
Previous Monthly High0.6531
Previous Monthly Low0.619
Daily Fibonacci 38.2%0.6262
Daily Fibonacci 61.8%0.628
Daily Pivot Point S10.6222
Daily Pivot Point S20.6189
Daily Pivot Point S30.6145
Daily Pivot Point R10.63
Daily Pivot Point R20.6344
Daily Pivot Point R30.6377

Author

Anil Panchal

Anil Panchal

FXStreet

Anil Panchal has nearly 15 years of experience in tracking financial markets. With a keen interest in macroeconomics, Anil aptly tracks global news/updates and stays well-informed about the global financial moves and their implications.

More from Anil Panchal
Share:

Markets move fast. We move first.

Orange Juice Newsletter brings you expert driven insights - not headlines. Every day on your inbox.

By subscribing you agree to our Terms and conditions.

Editor's Picks

EUR/USD off three-month highs, holds near 1.1800 on softer US Dollar

EUR/USD consolidates gains below 1.1800 in the European trading hours on Wednesday. A broadly subdued US Dollar continues to underpin the pair amid quiet markets and thin liquidity conditions on Christmas Eve. 

GBP/USD keeps range around 1.3500 amid quiet markets

GBP/USD keeps its range trade intact at around 1.3500 in the European session on Wednesday. The Pound Sterling holds the upper hand over the US Dollar amid pre-Christmas light trading as traders turn to sidelines heading into the holiday season. 

Gold retreats from record highs amid profit-taking on Christmas Eve

Gold retreats following the move higher to the $4,525 area, or a fresh all-time peak, though the downside remains limited amid a bullish fundamental backdrop. The US Dollar selling bias remains unabated on the back of dovish Fed expectations, which continues to act as a tailwind for the bullion amid persistent geopolitical risks.

Shiba Inu's bears tighten grip, aiming for yearly lows

Shiba Inu price remains under pressure, trading below $0.000070 on Wednesday as bearish momentum continues to dominate the broader crypto market. On-chain and derivatives data further support the bearish sentiment, while technical analysis suggests a deeper correction targeting the yearly lows.

Economic outlook 2026-2027 in advanced countries: Solidity test

After a year marked by global economic resilience and ending on a note of optimism, 2026 looks promising and could be a year of solid economic performance. In our baseline scenario, we expect most of the supportive factors at work in 2025 to continue to play a role in 2026.

Stellar Price Forecast: XLM slips below $0.22 as bearish momentum builds

Stellar (XLM) price is trading below $0.22 at the time of writing on Wednesday after failing to close above the key resistance earlier this week. Bearish momentum continues to strengthen, with open interest falling and short bets rising.