NZD/USD Price Analysis: Bearish dominance persists, signs of short-term bullish recovery detected


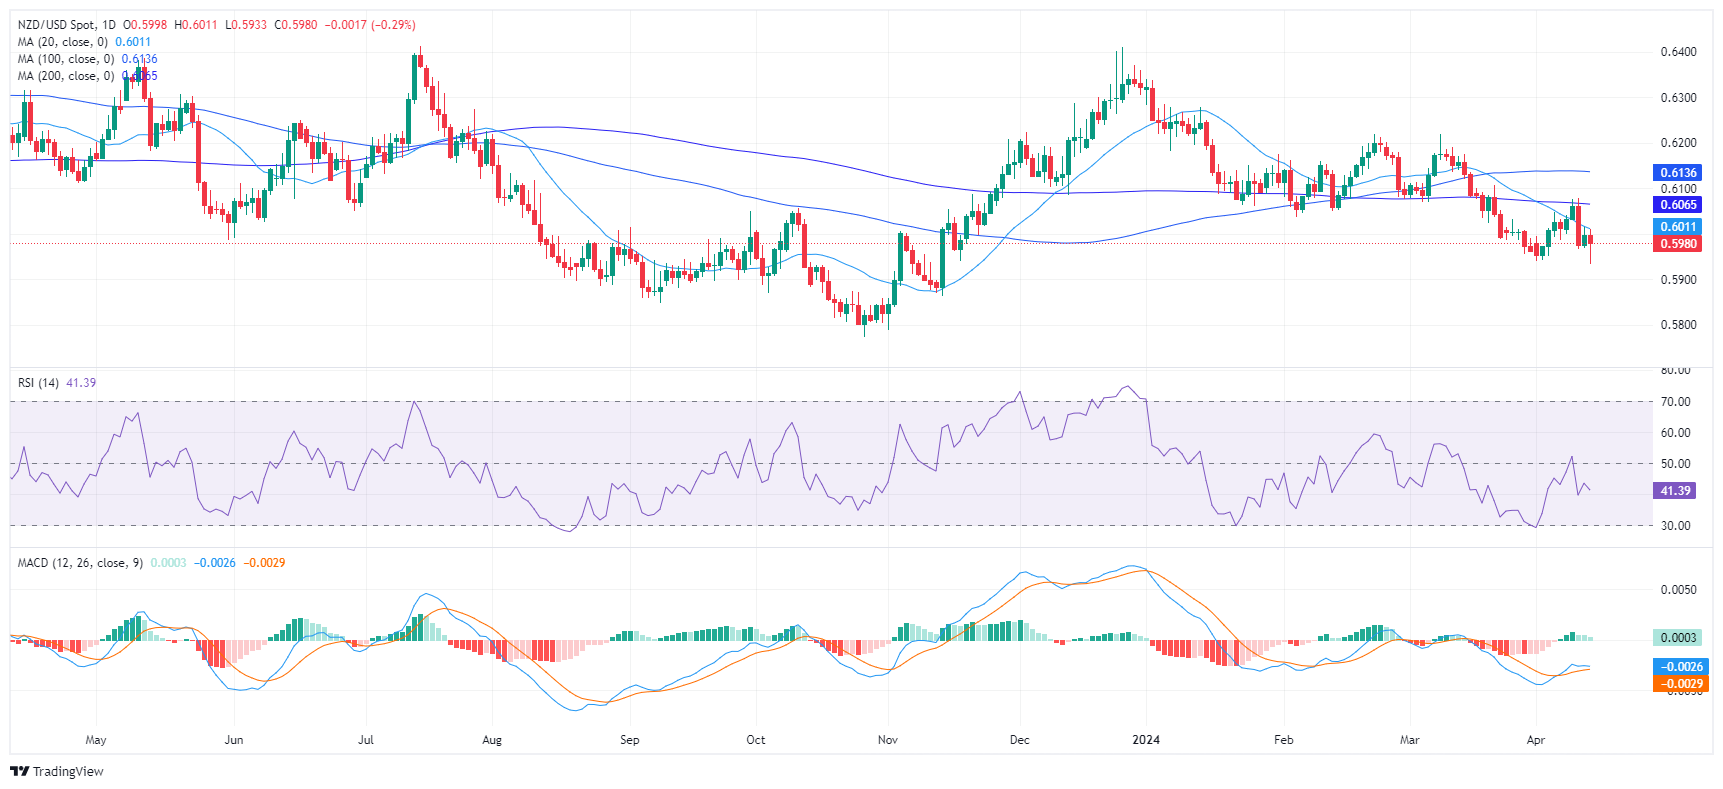
  • The daily RSI of the NZD/USD reveals that sellers remain in command with values below 50.
  • The daily MACD shows a slowdown in selling pressure as flat green bars begin to form.
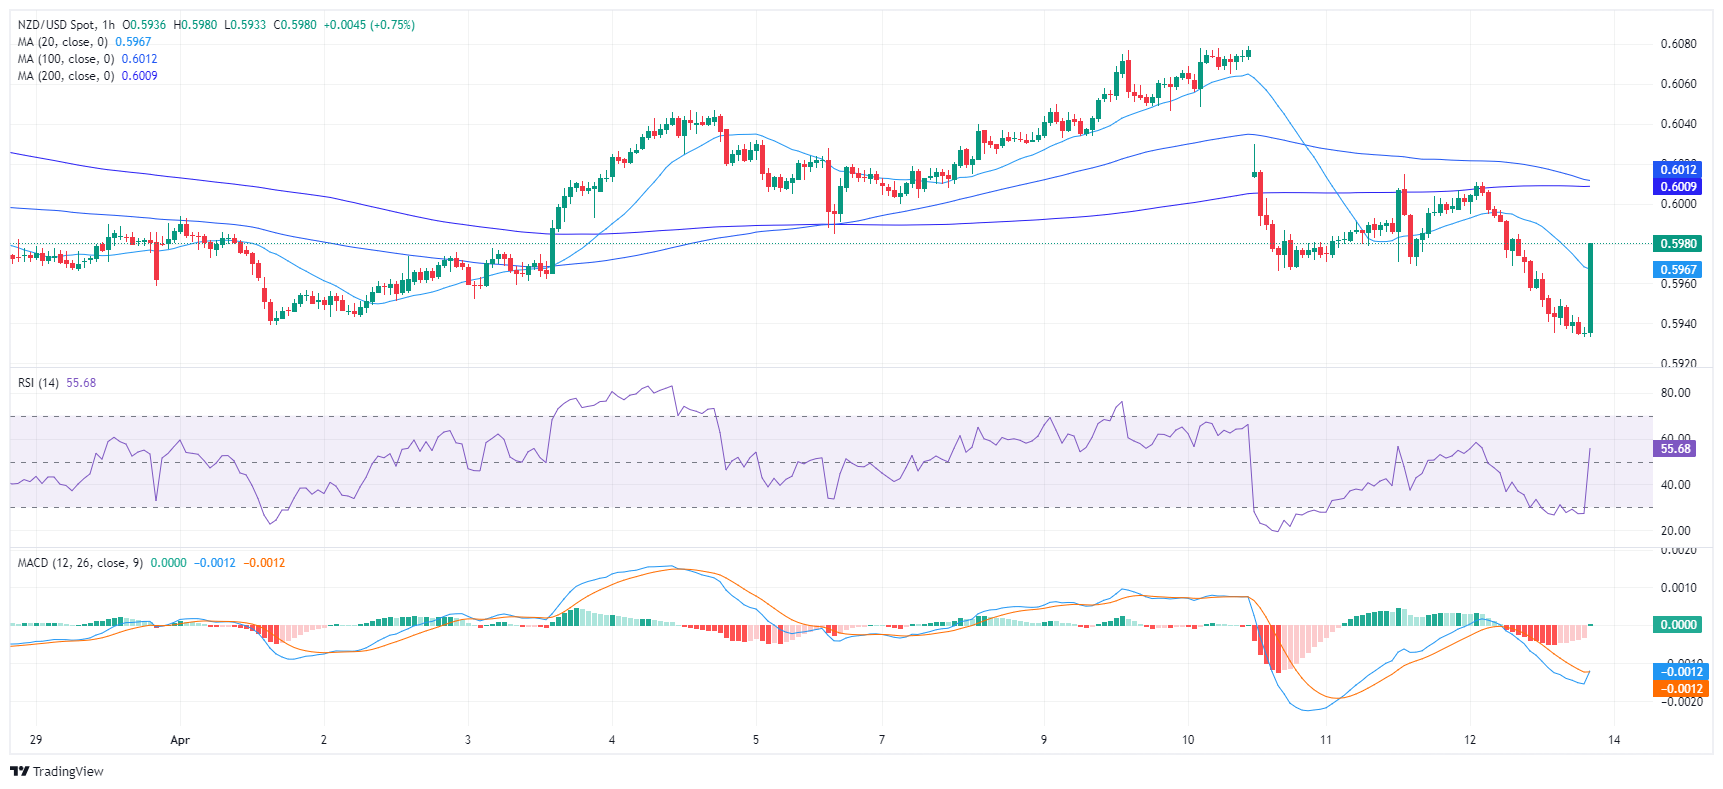
  • Buyers hint at gaining minor traction in the short term, with hourly indicators recovering.

The NZD/USD pair reflects the ongoing dominance of sellers, declining towards the 0.5935 mark. While signs of bearish control are evident, there is a clue of bullish resilience, hinting at a neutral to bearish outlook in the short term.

The daily  Relative Strength Index (RSI) maintains a consistent presence in the negative territory below 50, with the latest value at 38 which indicates that sellers are in command. That being said, green bars take shape on the Moving Average Convergence Divergence (MACD) histogram, indicating a slowing of the bearish momentum.

NZD/USD daily chart

In contrast, the hourly chart indicates a gradually increasing RSI with the latest reading at 47. This suggests a mild recovery of buying interest after dropping into oversold conditions earlier in the session. Moreover, the MACD histogram shows a fresh green bar, implying a positive change in the short term momentum.

NZD/USD hourly chart

With respect to the broader trend, the outlook is bearish with the pair below the 20,100 and 200-day Simple Moving Averages (SMAs). However, the pair is close to its 20-day average and if buyers regain additional ground and recapture it, the outlook may start to shift in favor of the bulls.


NZD/USD

Overview
Today last price 0.598
Today Daily Change -0.0017
Today Daily Change % -0.28
Today daily open 0.5997
 
Trends
Daily SMA20 0.6016
Daily SMA50 0.6084
Daily SMA100 0.6137
Daily SMA200 0.6066
 
Levels
Previous Daily High 0.6015
Previous Daily Low 0.5969
Previous Weekly High 0.6047
Previous Weekly Low 0.5939
Previous Monthly High 0.6218
Previous Monthly Low 0.5956
Daily Fibonacci 38.2% 0.5997
Daily Fibonacci 61.8% 0.5987
Daily Pivot Point S1 0.5973
Daily Pivot Point S2 0.5948
Daily Pivot Point S3 0.5927
Daily Pivot Point R1 0.6019
Daily Pivot Point R2 0.604
Daily Pivot Point R3 0.6065


Share: Feed news

Information on these pages contains forward-looking statements that involve risks and uncertainties. Markets and instruments profiled on this page are for informational purposes only and should not in any way come across as a recommendation to buy or sell in these assets. You should do your own thorough research before making any investment decisions. FXStreet does not in any way guarantee that this information is free from mistakes, errors, or material misstatements. It also does not guarantee that this information is of a timely nature. Investing in Open Markets involves a great deal of risk, including the loss of all or a portion of your investment, as well as emotional distress. All risks, losses and costs associated with investing, including total loss of principal, are your responsibility. The views and opinions expressed in this article are those of the authors and do not necessarily reflect the official policy or position of FXStreet nor its advertisers. The author will not be held responsible for information that is found at the end of links posted on this page.

If not otherwise explicitly mentioned in the body of the article, at the time of writing, the author has no position in any stock mentioned in this article and no business relationship with any company mentioned. The author has not received compensation for writing this article, other than from FXStreet.

FXStreet and the author do not provide personalized recommendations. The author makes no representations as to the accuracy, completeness, or suitability of this information. FXStreet and the author will not be liable for any errors, omissions or any losses, injuries or damages arising from this information and its display or use. Errors and omissions excepted.

The author and FXStreet are not registered investment advisors and nothing in this article is intended to be investment advice.

Recommended content


Recommended content

Editors’ Picks

EUR/USD stays in positive territory above 1.0850 after US data

EUR/USD stays in positive territory above 1.0850 after US data

EUR/USD clings to modest daily gains above 1.0850 in the second half of the day on Friday. The improving risk mood makes it difficult for the US Dollar to hold its ground after PCE inflation data, helping the pair edge higher ahead of the weekend.

EUR/USD News

GBP/USD stabilizes above 1.2850 as risk mood improves

GBP/USD stabilizes above 1.2850 as risk mood improves

GBP/USD maintains recovery momentum and fluctuates above 1.2850 in the American session on Friday. The positive shift seen in risk mood doesn't allow the US Dollar to preserve its strength and supports the pair.

GBP/USD News

Gold rebounds above $2,380 as US yields stretch lower

Gold rebounds above $2,380 as US yields stretch lower

Following a quiet European session, Gold gathers bullish momentum and trades decisively higher on the day above $2,380. The benchmark 10-year US Treasury bond yield loses more than 1% on the day after US PCE inflation data, fuelling XAU/USD's upside.

Gold News

Avalanche price sets for a rally following retest of key support level

Avalanche price sets for a rally following retest of  key support level

Avalanche (AVAX) price bounced off the $26.34 support level to trade at $27.95 as of Friday. Growing on-chain development activity indicates a potential bullish move in the coming days.

Read more

The election, Trump's Dollar policy, and the future of the Yen

The election, Trump's Dollar policy, and the future of the Yen

After an assassination attempt on former President Donald Trump and drop out of President Biden, Kamala Harris has been endorsed as the Democratic candidate to compete against Trump in the upcoming November US presidential election.

Read more

Forex MAJORS

Cryptocurrencies

Signatures