|

NZD/USD Price Analysis: Bearish bias persists, 20-day SMA gone

  • NZD/USD declined by 0.50% on Monday to reach 0.6145.
  • The RSI is in positive territory but declining, indicating a rising bearish traction.
  • The pair lost the 20-day SMA which flash sell signals.

Monday's session saw the New Zealand Dollar weaken against its US counterpart, extending its losing streak to two days. The NZD/USD pair fell by 0.50% to a low of 0.6145, as the bears continued to dominate the market.

The Relative Strength Index (RSI) is currently at 50, which is in positive territory but has a negative slope which suggests that the bears are advancing. The Moving Average Convergence Divergence (MACD) printed red bars, a sign of a continuation of the bear’s momentum. This is aligned with the recent price action, which shows the bears are in control.

NZD/USD daily chart

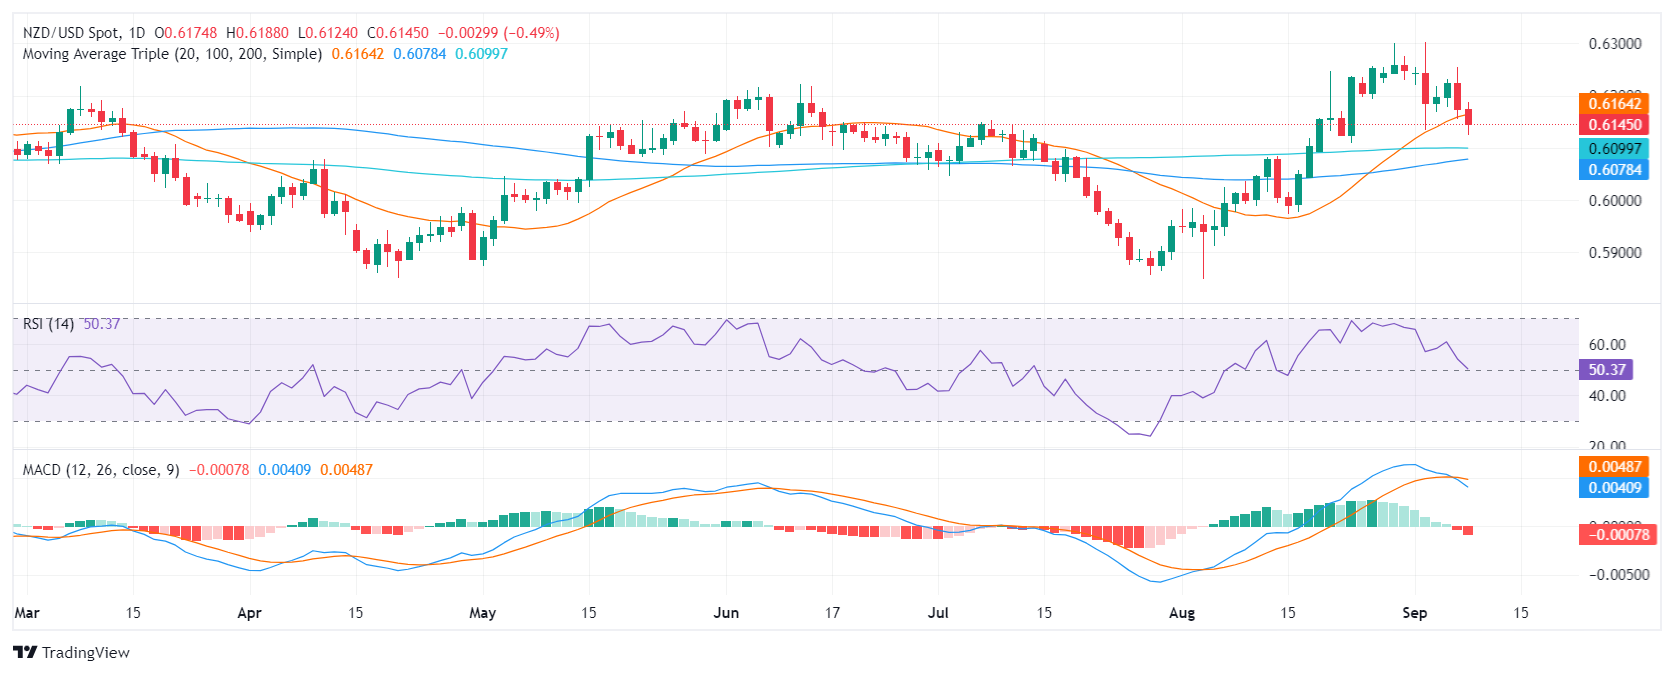
The 20-day Simple Moving Average (SMA) has now turned into a resistance level around the 0.6160 level and bulls will present support around the 0.6130 level and below at the psychological mark of 0.6100. The pair must recover the mentioned average to stop the bleeding.

.

Author

Patricio Martín

Patricio is an economist from Argentina passionate about global finance and understanding the daily movements of the markets.

More from Patricio Martín
Share:

Editor's Picks

AUD/USD eyes 0.7150 barrier nine-day EMA

AUD/USD inches higher after registering modest losses in the previous day, trading around 0.7130 during the Asian hours. The technical analysis of the daily chart indicates that the pair is moving sideways within the rectangle pattern, suggesting a consolidation as neither the bulls nor the bears have enough momentum to take control of the market.

USD/JPY trades below 160.00 intervention threshold; bullish bias intact

The USD/JPY pair attracts some sellers during the Asian session amid fears that authorities will step in again to prop up the Japanese Yen. Furthermore, the Israel-Lebanon truce prompts some profit-taking around the US Dollar and exerts downward pressure on the currency pair.

Gold puts its 200-day SMA to the test near $4,420

Gold keeps the bullish stance in place in the latter part of Thursday’s session, although a convincing break above the key $4,500 mark per troy ounce still remains elusive. The precious metal’s advance comes amid the resurgence of some selling interest around the Greenback, improving risk sentiment, and declining US Treasury yields across the board.

Bitcoin’s massive storm is back: Why the sell-off is far from over

Bitcoin price action over the last few weeks has felt less like a normal, healthy correction and more like a slow grinding crash that continues to wreak havoc on holdings and trading accounts. And everything suggests that the dramatic crash isn’t over.

Nonfarm payrolls: Testing the limits of Fed policy patience

The upcoming nonfarm payrolls report for May will provide the final update on the US labor market before Kevin Warsh attends his first policy meeting as the new Fed Chair later this month.

Recession on paper: What really moves the Canadian Loonie now?

Statistics Canada handed the headline writers a gift and the analysts a headache. Real GDP shrank 0.1% on an annualized basis in the first quarter, and with the fourth quarter of 2025 revised down to a 1.0% contraction, that is two negative quarters in a row, the textbook definition of a technical recession and Canada's first since the pandemic.