- NZD/USD has shown a recovery move from 0.6170 amid the risk-on market mood.
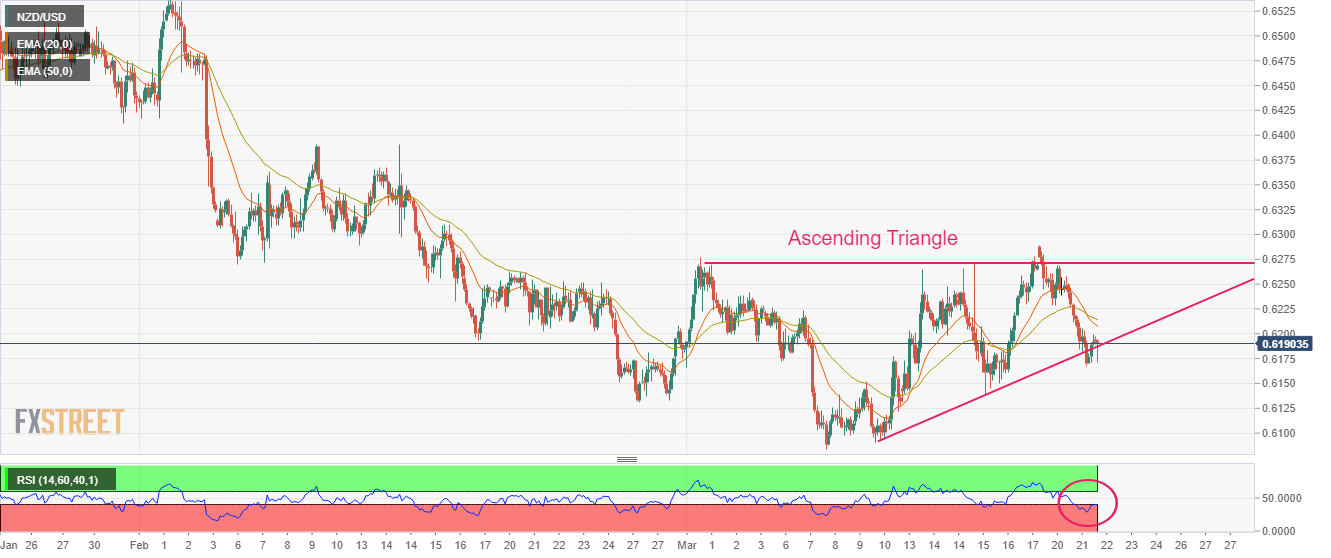
- The kiwi asset is hovering near the upward-sloping trendline of the Ascending Triangle pattern.
- Investors should be aware of the fact that responsive buying can be kicked in as the Kiwi asset is at make-or-break levels.
The NZD/USD pair is demonstrating a solid recovery from 0.6170 in the Asian session. The kiwi asset remained weak on Tuesday as fears of poor growth in New Zealand refreshed.
Analysts at UOB cited “The impacts of severe weather and flooding earlier this year will cloud the economic outlook. Our view is that the economy is likely to experience further weakness ahead. We have lowered our GDP growth forecast for 2023 to 1.3%, from 1.5% previously.”
S&P500 futures are showing nominal gains in the Asian session. The 500-US stocks basket futures are expected to continue their two-day winning streak further as United States Treasury Secretary Janet Yellen confirmed that Federal Reserve’s (Fed) new Bank Term Funding facility and discount window lending is working to provide liquidity to the banking system.
The US Dollar Index (DXY) has continued its sideways performance around 103.20 as investors are awaiting the interest rate decision by the Fed for fresh impetus.
On a two-hour scale, NZD/USD is hovering near the upward-sloping trendline of the Ascending Triangle chart pattern, which is plotted from March 09 low at 0.6105. While the horizontal resistance of the chart pattern is placed from March 01 high around 0.6277.
A bear cross, represented by the 20-and 50-period Exponential Moving Averages (EMAs) at 0.6220, indicates more weakness ahead.
Investors should be aware of the fact that responsive buying can be kicked in as the Kiwi asset is at make or break level.
The Relative Strength Index (RSI) (14) has slipped below 40.00, showing no signs of divergence, and oversold yet.
A buying opportunity in the Kiwi asset will emerge it will surpass March 1 high at 0.6276, which will drive the pair toward the round-level resistance at 0.6300 followed by February 14 high at 0.6389.
In an alternate scenario, a breakdown of March 21 low at 0.6167 will drag the asset toward March 15 low at 0.6139. A slippage below the latter will expose the asset for more downside toward the round-level support at 0.6100.
NZD/USD two-hour chart
Information on these pages contains forward-looking statements that involve risks and uncertainties. Markets and instruments profiled on this page are for informational purposes only and should not in any way come across as a recommendation to buy or sell in these assets. You should do your own thorough research before making any investment decisions. FXStreet does not in any way guarantee that this information is free from mistakes, errors, or material misstatements. It also does not guarantee that this information is of a timely nature. Investing in Open Markets involves a great deal of risk, including the loss of all or a portion of your investment, as well as emotional distress. All risks, losses and costs associated with investing, including total loss of principal, are your responsibility. The views and opinions expressed in this article are those of the authors and do not necessarily reflect the official policy or position of FXStreet nor its advertisers. The author will not be held responsible for information that is found at the end of links posted on this page.
If not otherwise explicitly mentioned in the body of the article, at the time of writing, the author has no position in any stock mentioned in this article and no business relationship with any company mentioned. The author has not received compensation for writing this article, other than from FXStreet.
FXStreet and the author do not provide personalized recommendations. The author makes no representations as to the accuracy, completeness, or suitability of this information. FXStreet and the author will not be liable for any errors, omissions or any losses, injuries or damages arising from this information and its display or use. Errors and omissions excepted.
The author and FXStreet are not registered investment advisors and nothing in this article is intended to be investment advice.
Recommended content
Editors’ Picks
EUR/USD clings to daily gains above 1.0650
EUR/USD gained traction and turned positive on the day above 1.0650. The improvement seen in risk mood following the earlier flight to safety weighs on the US Dollar ahead of the weekend and helps the pair push higher.
GBP/USD recovers toward 1.2450 after UK Retail Sales data
GBP/USD reversed its direction and advanced to the 1.2450 area after touching a fresh multi-month low below 1.2400 in the Asian session. The positive shift seen in risk mood on easing fears over a deepening Iran-Israel conflict supports the pair.
Gold holds steady at around $2,380 following earlier spike
Gold stabilized near $2,380 after spiking above $2,400 with the immediate reaction to reports of Israel striking Iran. Meanwhile, the pullback seen in the US Treasury bond yields helps XAU/USD hold its ground.
Bitcoin Weekly Forecast: BTC post-halving rally could be partially priced in Premium
Bitcoin price shows no signs of directional bias while it holds above $60,000. The fourth BTC halving is partially priced in, according to Deutsche Bank’s research.
Week ahead – US GDP and BoJ decision on top of next week’s agenda
US GDP, core PCE and PMIs the next tests for the Dollar. Investors await BoJ for guidance about next rate hike. EU and UK PMIs, as well as Australian CPIs also on tap.