|

NZD/USD Price Analysis: Ascending-triangle targets 0.6300

  • The NZD/USD is pairing Monday’s losses, up by 0.84%.
  • From a daily chart perspective, the NZD/USD is neutral-upward biased, though it needs to clear 0.6200.
  • An ascending channel in the NZD/USD 4-hour chart will exacerbate a rally towards 0.6300.

The New Zealand Dollar (NZD) trims Monday’s losses and rises back above the 0.6100 figure due to overall US Dollar (USD) weakness, as market sentiment improved, though it remains fragile. Therefore, the NZD/USD is trading at 0.6148, above its opening price by 0.80%, after hitting a daily low of 0.6094.

NZD/USD Price Analysis: Technical outlook

From a daily chart perspective, the NZD/USD is neutral-to-upward biased, consolidated for the last six days, within the 0.6100 – 0.6200 range. Of note, the NZD/USD exited from a descending channel six days ago, a solid breakout, meaning that the major might rally toward higher prices. Nevertheless, although in bullish territory, the Relative Strength Index (RSI) aims downwards, meaning buyers are losing momentum or getting a respite ahead of challenging the 200-day Exponential Moving Average (EMA) at  0.6303.

Short term, the NZD/USD 4-hour chart suggests an ascending channel is forming, which, once broken to the upside, would expose key resistance levels. Nevertheless, the NZD/USD is struggling to clear the R1 daily pivot at 0.6150, which, once cleared, could open the door toward 0.6200, followed by the August 24 swing high at 0.6251, ahead of the 0.6300 psychological level.

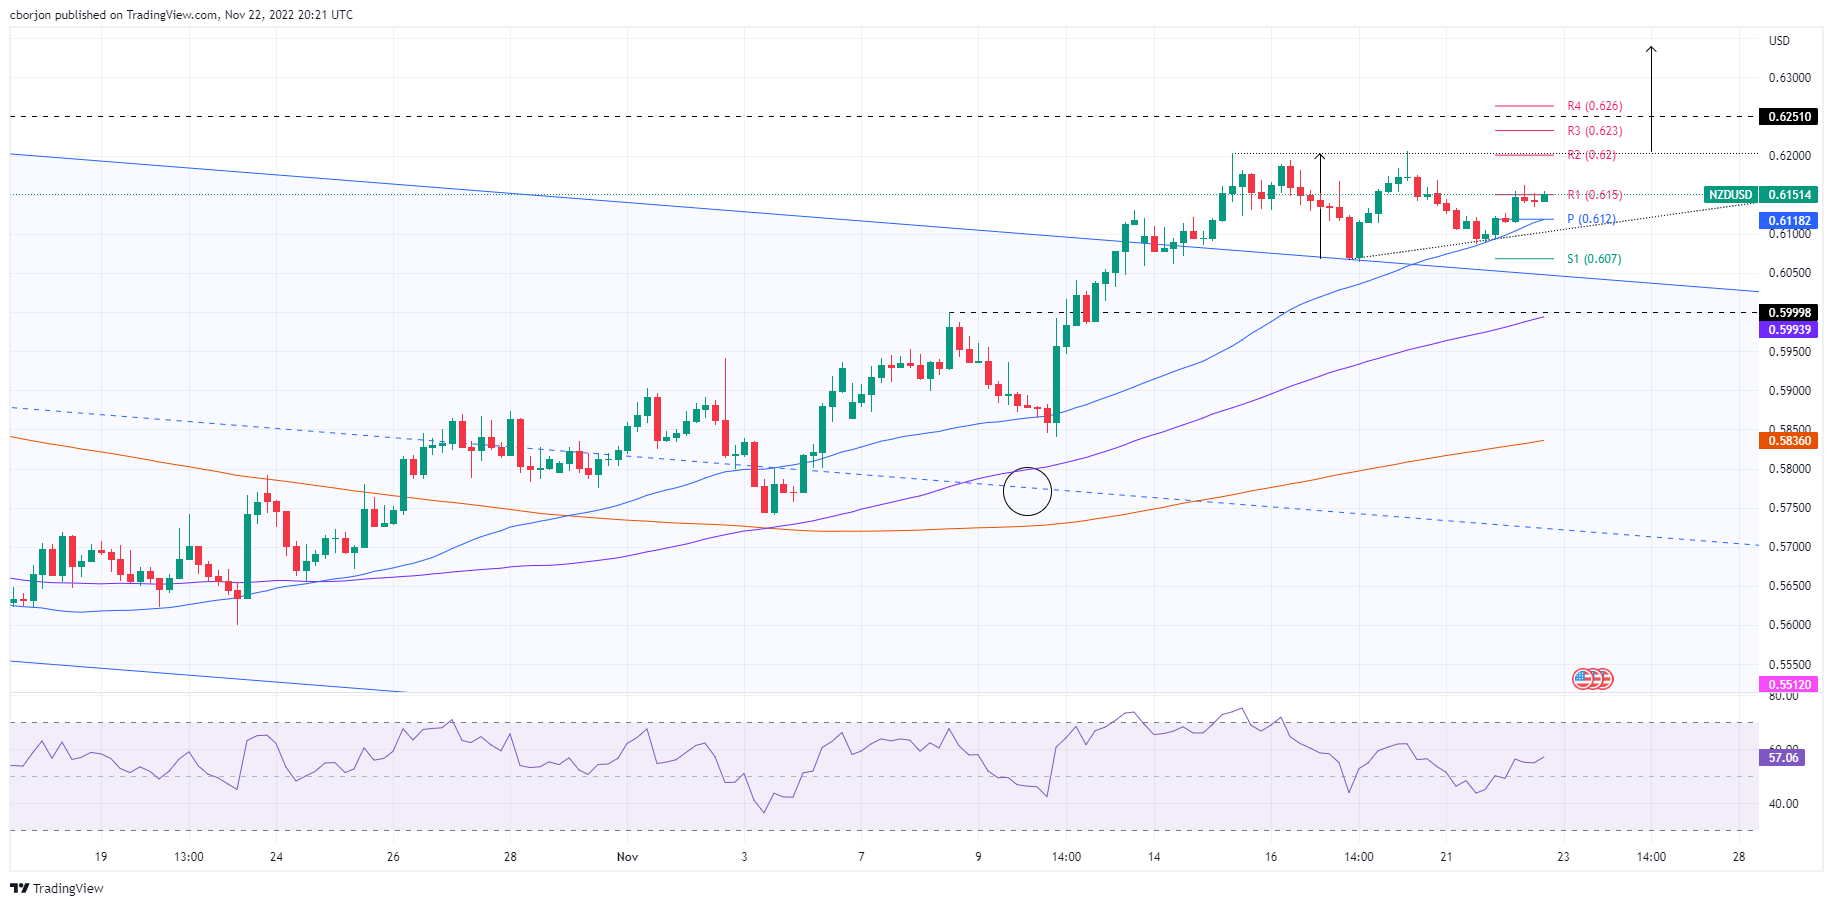
NZD/USD Key Technical Levels

NZD/USD

Overview
Today last price0.6152
Today Daily Change0.0050
Today Daily Change %0.82
Today daily open0.6102
 
Trends
Daily SMA200.5952
Daily SMA500.5824
Daily SMA1000.6017
Daily SMA2000.631
 
Levels
Previous Daily High0.617
Previous Daily Low0.6087
Previous Weekly High0.6206
Previous Weekly Low0.6062
Previous Monthly High0.5874
Previous Monthly Low0.5512
Daily Fibonacci 38.2%0.6119
Daily Fibonacci 61.8%0.6138
Daily Pivot Point S10.6069
Daily Pivot Point S20.6037
Daily Pivot Point S30.5987
Daily Pivot Point R10.6152
Daily Pivot Point R20.6202
Daily Pivot Point R30.6234

Author

Christian Borjon Valencia

Markets analyst, news editor, and trading instructor with over 14 years of experience across FX, commodities, US equity indices, and global macro markets.

More from Christian Borjon Valencia
Share:

Editor's Picks

EUR/USD looks sidelined around 1.1850

EUR/USD remains on the back foot, extending its bearish tone and sliding towards the 1.1850 area to print fresh daily lows on Monday. The move lower comes as the US Dollar gathers modest traction, with thin liquidity and subdued volatility amplifying price swings amid the US market holiday.

GBP/USD flirts with daily lows near 1.3630

GBP/USD has quickly given back Friday’s solid gains, turning lower at the start of the week and drifting back towards the 1.3630 area. The focus now shifts squarely to Tuesday’s UK labour market report, which is likely to keep the quid firmly in the spotlight and could set the tone for Cable’s next move.

Gold battle around $5,000 continues

Gold is giving back part of Friday’s sharp rebound, deflating below the key $5,000 mark per troy ounce as the new week gets underway. Modest gains in the US Dollar are keeping the metal in check, while thin trading conditions, due to the Presidents Day holiday in the US, are adding to the choppy and hesitant tone across markets.

Bitcoin consolidates as on-chain data show mixed signals

Bitcoin price has consolidated between $65,700 and $72,000 over the past nine days, with no clear directional bias. US-listed spot ETFs recorded a $359.91 million weekly outflow, marking the fourth consecutive week of withdrawals.

The week ahead: Key inflation readings and why the AI trade could be overdone

It is likely to be a quiet start to the week, with US markets closed on Monday for Presidents Day. European markets are higher across the board and gold is clinging to the $5,000 level after the tamer than expected CPI report in the US reduced haven flows to precious metals.

XRP steadies in narrow range as fund inflows, futures interest rise

Ripple is trading in a narrow range between $1.45 (immediate support) and $1.50 (resistance) at the time of writing on Monday. The remittance token extended its recovery last week, peaking at $1.67 on Sunday from the weekly open at $1.43.