|

NZD/USD Price analysis: 100-HMA holds the key to Kiwi pair’s upside past 0.6200

  • NZD/USD struggles to extend the previous day’s recovery moves but stays on the way to posting weekly gains.
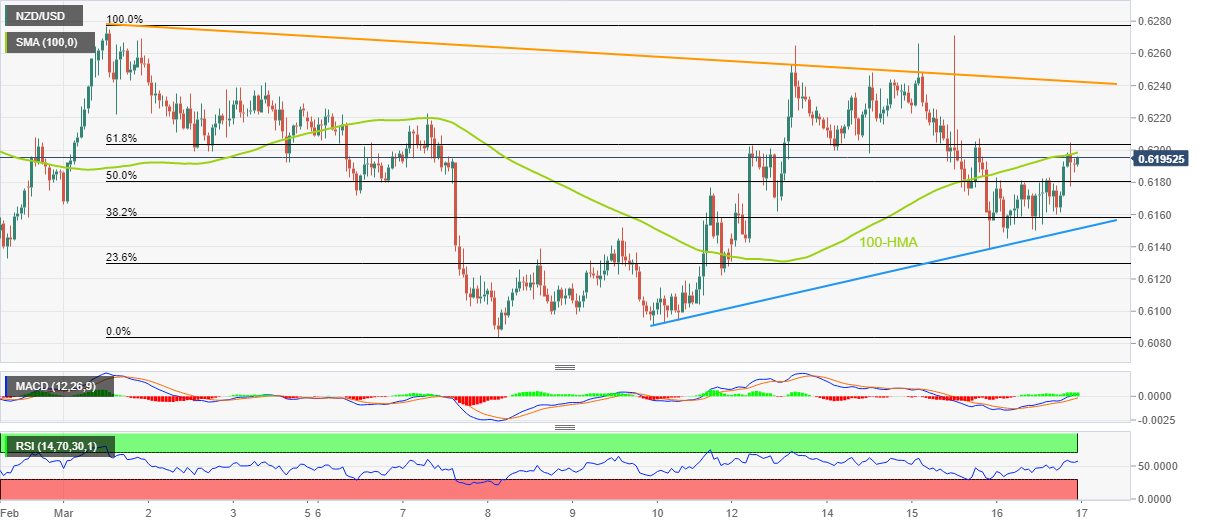
  • 100-HMA probes buyers even as upbeat oscillators, one-week-old support line suggest further upside of the Kiwi pair.
  • Descending trend line from early March appears the key upside hurdle for the bulls to cross.

NZD/USD makes rounds to the key moving average as buyers struggle to keep the reins around 0.6200, bracing for the weekly gains, during early Friday.

In doing so, the Kiwi pair benefits from the upbeat RSI (14), not overbought, as well as bullish MACD signals. Not only the price-positive oscillators but the quote’s U-turn from a one-week-old ascending trend line also keeps the NZD/USD buyers hopeful of witnessing further upside.

Hence, the buyers are ready to overcome the immediate 100-Hour Moving Average (HMA), surrounding the 0.6200 threshold.

However, the 61.8% Fibonacci retracement level of the pair’s March 01-08 downside, near 0.6205, could act as a validation point for the rally targeting a downward-sloping resistance line since the month’s start, around 0.6245 at the latest.

Should the NZD/USD bulls stay in the driver’s seat beyond 0.6245, the odds of witnessing a fresh monthly high, currently around 0.6280, can’t be ruled out.

Alternatively, pullback moves may initially aim for the 50% Fibonacci retracement level of 0.6180 before directing the NZD/USD bears towards the aforementioned one-week-old support line, close to 0.6150 by the press time.

It should be noted, however, that the NZD/USD pair’s sustained trading below 0.6150 makes it vulnerable to testing the monthly low of 0.6084. During the fall, the 0.6100 round figure may act as an intermediate halt.

NZD/USD: Hourly chart

Trend: Limited upside expected

Additional important levels

Overview
Today last price0.6191
Today Daily Change0.0003
Today Daily Change %0.05%
Today daily open0.6188
 
Trends
Daily SMA200.6196
Daily SMA500.6315
Daily SMA1000.6254
Daily SMA2000.6164
 
Levels
Previous Daily High0.6271
Previous Daily Low0.6172
Previous Weekly High0.6226
Previous Weekly Low0.6084
Previous Monthly High0.6538
Previous Monthly Low0.6131
Daily Fibonacci 38.2%0.621
Daily Fibonacci 61.8%0.6233
Daily Pivot Point S10.615
Daily Pivot Point S20.6111
Daily Pivot Point S30.6051
Daily Pivot Point R10.6249
Daily Pivot Point R20.631
Daily Pivot Point R30.6348

Author

Anil Panchal

Anil Panchal

FXStreet

Anil Panchal has nearly 15 years of experience in tracking financial markets. With a keen interest in macroeconomics, Anil aptly tracks global news/updates and stays well-informed about the global financial moves and their implications.

More from Anil Panchal
Share:

Markets move fast. We move first.

Orange Juice Newsletter brings you expert driven insights - not headlines. Every day on your inbox.

By subscribing you agree to our Terms and conditions.

Editor's Picks

EUR/USD bounces toward 1.1750 as US Dollar loses strength

EUR/USD returned to the 1.1750 price zone in the American session on Friday, despite falling Wall Street, which indicates risk aversion. Trading conditions remain thin following the New Year holiday and ahead of the weekend, with the focus shifting to US employment and European data scheduled for next week.

GBP/USD nears 1.3500, holds within familiar levels

After testing 1.3400 on the last day of 2025, GBP/USD managed to stage a rebound. Nevertheless, the pair finds it difficult to gather momentum and trades with modest intraday gains at around 1.3490 as market participants remain in holiday mood.

Gold trims intraday gains, approaches $4,300

Gold retreated sharply from the $4,400  area and trades flat for the day in the $4,320 price zone. Choppy trading conditions exacerbated the intraday decline, although XAU/USD bearish case is out of the picture, considering growing expectations for a dovish Fed and persistent geopolitical tensions.

Cardano gains early New Year momentum, bulls target falling wedge breakout

Cardano kicks off the New Year on a positive note and is extending gains, trading above $0.36 at the time of writing on Friday. Improving on-chain and derivatives data point to growing bullish interest, while the technical outlook keeps an upside breakout in focus.

Economic outlook 2026-2027 in advanced countries: Solidity test

After a year marked by global economic resilience and ending on a note of optimism, 2026 looks promising and could be a year of solid economic performance. In our baseline scenario, we expect most of the supportive factors at work in 2025 to continue to play a role in 2026.

Crypto market outlook for 2026

Year 2025 was volatile, as crypto often is.  Among positive catalysts were favourable regulatory changes in the U.S., rise of Digital Asset Treasuries (DAT), adoption of AI and tokenization of Real-World-Assets (RWA).