NZD/USD holds below YTD peak, capped in rising wedge pattern
- NZD/USD trades around 0.6045 on Friday after hitting an intraday high of 0.6079.
- The pair remains within a rising wedge formation, typically a bearish setup.
- NZD/USD hit 0.6089 on June 16, marking its YTD high, but has since lacked bullish follow-through.

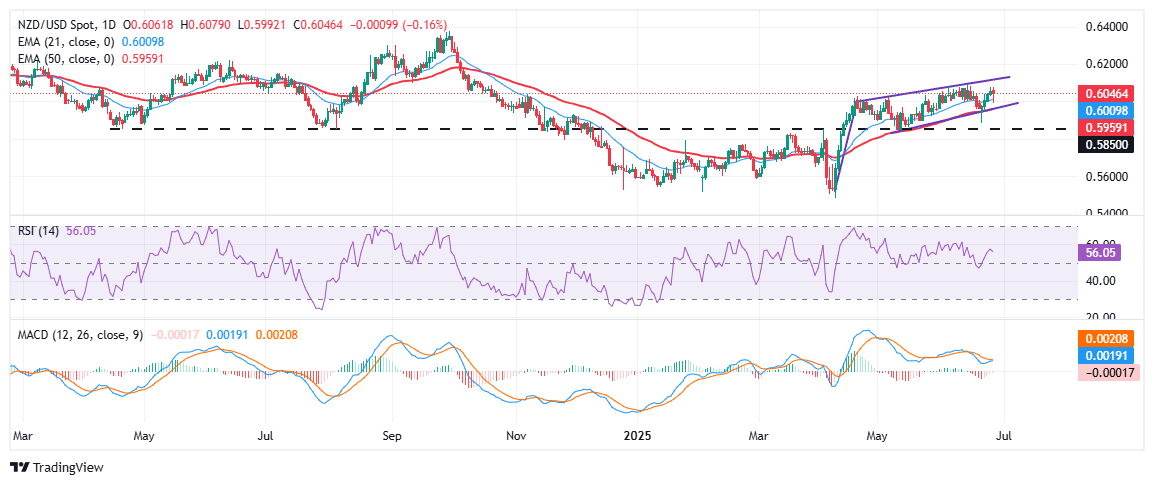
NZD/USD struggles to extend its recent advance on Friday, hovering near 0.6045 after an intraday high of 0.6079. The pair remains trapped inside a rising wedge formation, typically a bearish signal, as the broadly weak US Dollar steadies. The US Dollar Index (DXY) is holding above the 97.00 threshold, curbing the Greenback’s sharp pullback and weighing on Kiwi upside.
From a technical perspective, NZD/USD remains capped within a rising wedge formation that has developed since late April, a pattern often viewed as a precursor to a bearish reversal. The pair topped out at 0.6089 on June 16, marking its Year-to-Date high, but has since failed to post a higher high, suggesting growing upside exhaustion. The 21-day Exponential Moving Average (EMA) near 0.6010 continues to offer dynamic support, while the 50-day EMA at 0.5955 stands as the next key line of defense on a breakdown.
Momentum indicators are beginning to flash early warning signals. The Relative Strength Index (RSI) is hovering just near 55, lacking strong directional bias, while the Moving Average Convergence Divergence (MACD) is showing signs of convergence, suggesting that bullish momentum may be fading.
A confirmed break below the wedge support — currently near the psychological 0.6000 handle — could trigger a sharper decline toward 0.5950, with deeper losses potentially targeting the 0.5850 zone, which acted as a base for the April–June rally.
On the upside, bulls would need to strongly break above 0.6089 YTD high to negate the bearish wedge narrative. A clean breakout of the above resistance, the upper boundary of the wedge, could see the pair extend toward the 0.6150–0.6220 level, last seen in October 2024.
New Zealand Dollar PRICE Today
The table below shows the percentage change of New Zealand Dollar (NZD) against listed major currencies today. New Zealand Dollar was the strongest against the Canadian Dollar.
| USD | EUR | GBP | JPY | CAD | AUD | NZD | CHF | |
|---|---|---|---|---|---|---|---|---|
| USD | 0.01% | 0.31% | 0.22% | 0.63% | 0.47% | 0.28% | -0.02% | |
| EUR | -0.01% | 0.25% | 0.19% | 0.61% | 0.43% | 0.13% | -0.09% | |
| GBP | -0.31% | -0.25% | -0.02% | 0.33% | 0.17% | -0.07% | -0.25% | |
| JPY | -0.22% | -0.19% | 0.02% | 0.40% | 0.23% | -0.12% | -0.18% | |
| CAD | -0.63% | -0.61% | -0.33% | -0.40% | -0.13% | -0.47% | -0.61% | |
| AUD | -0.47% | -0.43% | -0.17% | -0.23% | 0.13% | -0.29% | -0.43% | |
| NZD | -0.28% | -0.13% | 0.07% | 0.12% | 0.47% | 0.29% | -0.14% | |
| CHF | 0.02% | 0.09% | 0.25% | 0.18% | 0.61% | 0.43% | 0.14% |
The heat map shows percentage changes of major currencies against each other. The base currency is picked from the left column, while the quote currency is picked from the top row. For example, if you pick the New Zealand Dollar from the left column and move along the horizontal line to the US Dollar, the percentage change displayed in the box will represent NZD (base)/USD (quote).
Author

Vishal Chaturvedi
FXStreet
I am a macro-focused research analyst with over four years of experience covering forex and commodities market. I enjoy breaking down complex economic trends and turning them into clear, actionable insights that help traders stay ahead of the curve.


