|

NZD/JPY Price Analysis:Sellers take a pause, upwards correction in sight

  • NZD/JPY pair has been moving downwards in the last week, but today's price action showed a sharp uptick.
  • The RSI is in a negative area, but its value is sharply rising suggesting that buying pressure is recovering.
  • The MACD suggests that selling pressure is flattening.

Monday's session saw the NZD/JPY pair rise by 0.60% to 87.20. However, the overall technical outlook for the NZD/JPY remains negative due to the losses seen in the last week as sellers seem to be taking a breather.

The RSI is currently at 36, which is still near the oversold area. However, the slope of the RSI is sharply rising, which suggests that buying pressure is recovering. The MACD is also red and flat, indicating that selling pressure is flat. This suggests that last week’s downward movements became over-extended and the sellers paused to take a breather. This also gives light to the buyers as the cross might continue consolidating upwards.

NZD/JPY daily chart

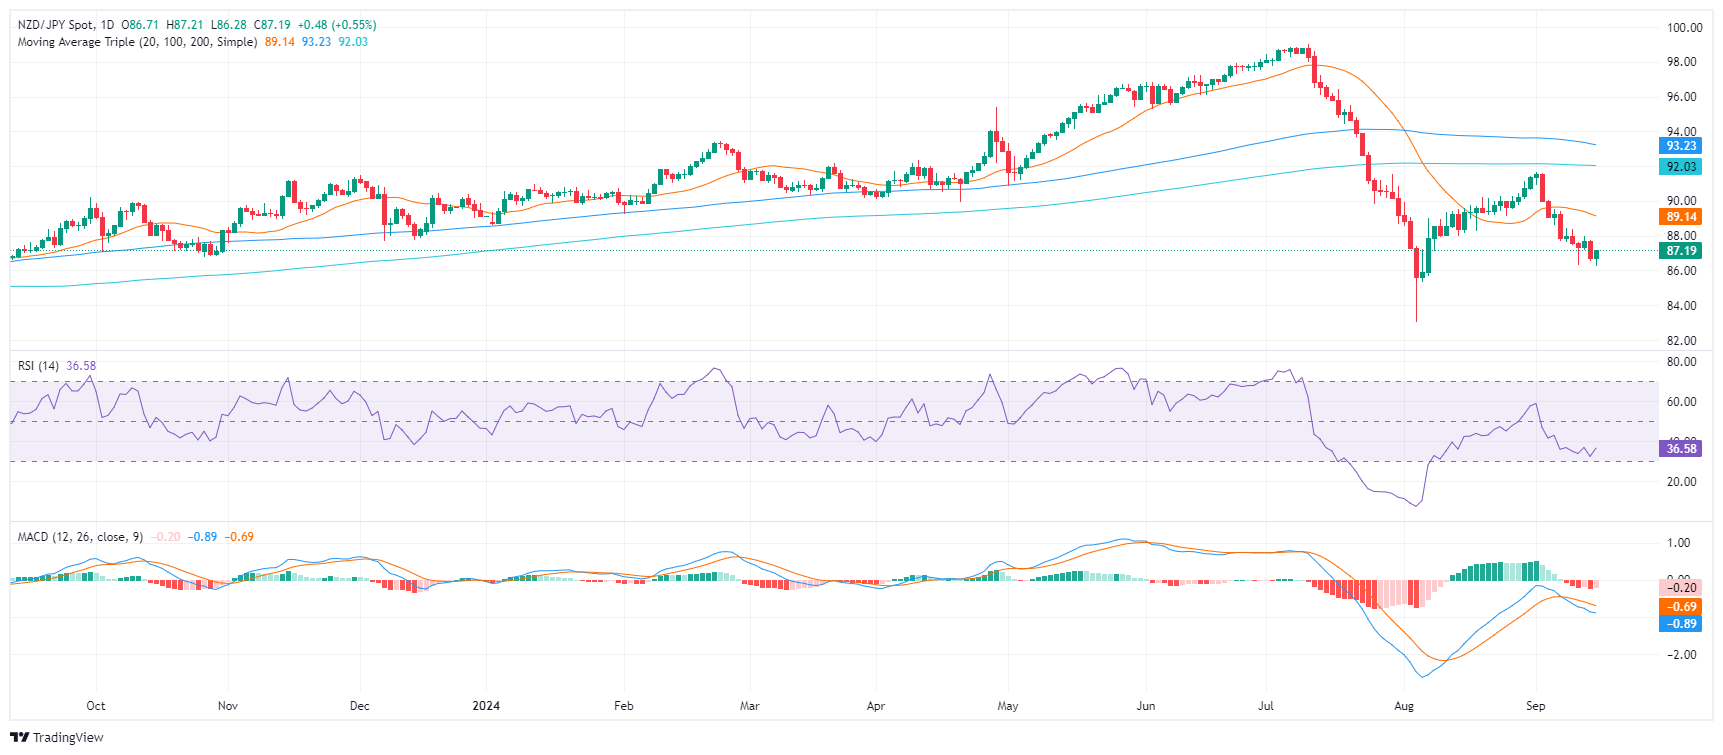
Supports to the downside are located at 86.30, 86.60, and 87.00, while resistances are seen at 87.30, 87.60, and 87.90.

Author

Patricio Martín

Patricio is an economist from Argentina passionate about global finance and understanding the daily movements of the markets.

More from Patricio Martín
Share:

Editor's Picks

AUD/USD stays bid above 0.7100 on Australian trade data, Mideast optimism

AUD/USD clings to minor recovery gains above 0.7100 in the Asian session on Thursday as a new Israel-Lebanon ceasefire keeps a lid on the safe-haven US Dollar. Meanwhile, strong AustralianTrade Balane data also help the Aussie pair sustain the bounce from weekly lows.

USD/JPY hovers near the 160.00 intervention threshold on Mideast tensions

USD/JPY struggles to find acceptance above 160.00 and retreats from a one-month high in the Asian session on Thursday amid fears that authorities will step in again to prop up the Japanese Yen. Furthermore, a new Israel-Lebanon ceasefire caps the US Dollar and supports the currency pair. However, renewed US-Iran tensions keep the downside limited in the Greenback and the pair.

Gold defends 200-day SMA; upside seems capped on Iran uncertainty

Gold recovers from a one-week low near $4,425, or the 200-day SMA, in the Asian session on Thursday, as news of an Israel-Lebanon ceasefire acts as a headwind for the safe-haven US Dollar. However, renewed hostilities in the Gulf, along with stalled US-Iran peace talks, keep geopolitical risks in play and should support the USD, checking the Gold price rebound.


Ethereum: Long-term holders' capitulation drives ETH below $1,800

Ethereum has fallen below $1,800 on Wednesday, the first time since May 2025 following accelerated spot selling pressure and distributions from long-term holders. The Age Consumed metric, which tracks the movement of previously idle tokens or long-term holders' coins, spiked over the past two days as prices declined, indicating increased selling activity among this cohort.

Kevin Warsh takes the Fed helm: What it means for the US Dollar
The Federal Reserve moves away from the highly predictable "forward guidance" model of the Jerome Powell era to a new “Kevin Warsh environment”, characterized by less communication, more policy surprises, and an increased focus on the Fed's complex balance sheet.
Recession on paper: What really moves the Canadian Loonie now?

Statistics Canada handed the headline writers a gift and the analysts a headache. Real GDP shrank 0.1% on an annualized basis in the first quarter, and with the fourth quarter of 2025 revised down to a 1.0% contraction, that is two negative quarters in a row, the textbook definition of a technical recession and Canada's first since the pandemic.