|

NZD/JPY Price Analysis: Pauses after striking new yearly high; buyer dominance yet to wane

  • NZD/JPY trades flat at 87.40, retracing slightly after reaching a new YTD high.
  • Buyers remain in charge; however, a flat slope suggests potential near-term consolidation.
  • Caution is warranted as RSI and Rate of Change indicate weakening buyer momentum.

NZD/JPY retraces slightly as the Asian session begins after posting solid gains on Thursday of 0.58% and reaches a new year-to-date (YTD) high of 87.59. At the time of writing, the NZD/JPY is almost flat, exchanging hands at 87.40.

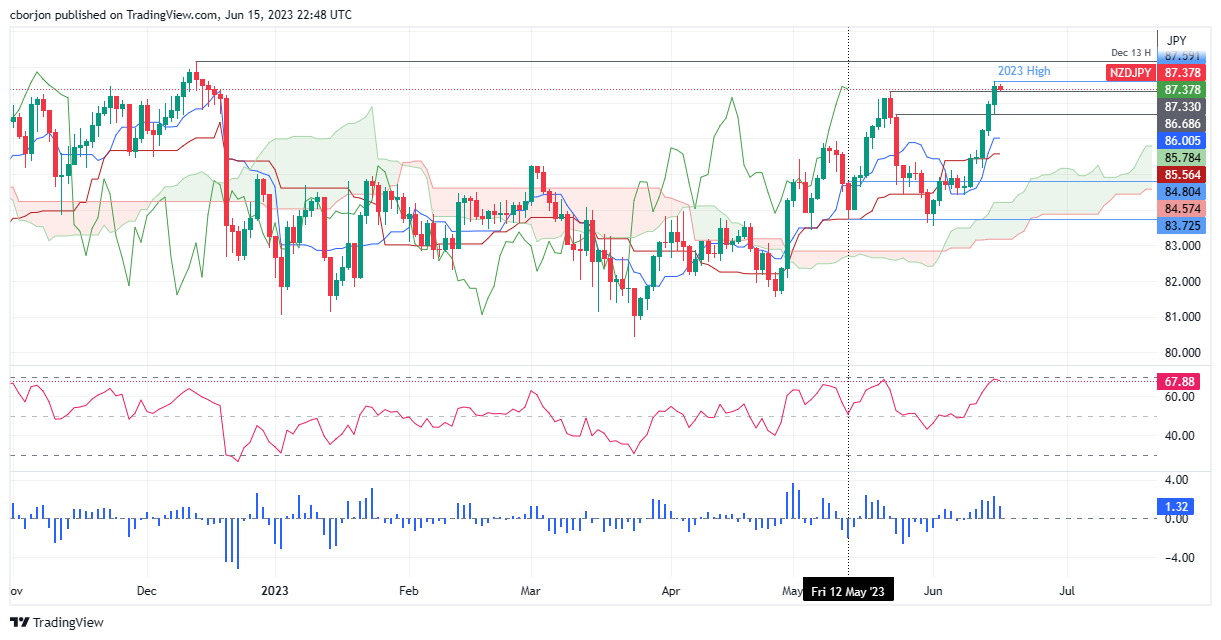
NZD/JPY Price Analysis: Technical outlook

The NZD/JPY is still upward biased from a daily chart perspective, as the pair remains above the Ichimoku cloud. In addition, the cross-over of the Tenkan-Sen line above the Kijun-Sen, suggests that buyers remain in charge. But the slope of the latter for the last nine days shifted flat, suggesting some consolidation lies ahead before the NZD/JPY attacks the next resistance level at 88.17, the December 13 high.

If the NZD/JPY breaks the abovementioned price level, the next stop would be the 89.00 psychological level, as the pair gets on its way toward testing the 2015 high at 92.42. Conversely, the NZD/JPY first support would be the May 23 high at 87.31, which, once cleared, would expose the May 24 daily high turned support at 86.68. The following support levels would be the Tenkan-Sen line at 86.00 and the Kijun-Sen line at 85.56.

Given that the Ichimoku cloud suggests the NZD/JPY is upwards, oscillators like the Relative Strength Index (RSI) indicate that the pair is approaching overbought territory, but its slope aims down. The three-day Rate of Change (RoC) shows buyers are losing momentum.

Trend: Neutral-upward biased, but caution is warranted.

NZD/JPY Price Action – Daily chart

NZD/JPY Daily chart

NZD/JPY

Overview
Today last price87.36
Today Daily Change0.45
Today Daily Change %0.52
Today daily open86.91
 
Trends
Daily SMA2085.35
Daily SMA5084.39
Daily SMA10083.87
Daily SMA20084.31
 
Levels
Previous Daily High87
Previous Daily Low86.07
Previous Weekly High85.55
Previous Weekly Low84.42
Previous Monthly High87.31
Previous Monthly Low83.44
Daily Fibonacci 38.2%86.64
Daily Fibonacci 61.8%86.42
Daily Pivot Point S186.32
Daily Pivot Point S285.73
Daily Pivot Point S385.39
Daily Pivot Point R187.25
Daily Pivot Point R287.59
Daily Pivot Point R388.18

Author

Christian Borjon Valencia

Markets analyst, news editor, and trading instructor with over 14 years of experience across FX, commodities, US equity indices, and global macro markets.

More from Christian Borjon Valencia
Share:

Editor's Picks

GBP/USD remains in two-day highs around 1.3260

GBP/USD adds to Friday’s bounce, gathering fresh traction and flirting with the 1.3270 zone on Monday, or two-day tops. Cable’s decent advance comes despite the move higher in the Greenback and investors’ assessing of UK PM K. Starmer's resignation.

EUR/USD remains offered; focus is on 1.1400

EUR/USD rapidly gives back Friday’s rebound and trades with marked losses near 1.1420, or three-month lows, in the latter part of Monday’s NA session. The pair’s intensifies its retracement following the continuation of the robust upside momentum in the US Dollar. Next on tap will be preliminary PMIs the Germany and the Euroland.

Gold bounces off lows, looks to surpass $4,200

Gold regains composure and leaves behind three-consecutive daily declines on Monday, looking to regain the area above the $4,200 mark per troy ounce. Reports of progress in the latest round of US-Iran talks are helping the precious metal maintain its footing at the start of the week, although the stronger Greenback seems to limit the upside potential for now.

XRP recovery underpinned by persistent ETF inflows
Ripple (XRP) gains momentum on Monday, trading above $1.15 as the crypto market widely recovers. This recovery comes amid easing geopolitical tensions in the Middle East, following reports that the United States (US) and Iran made progress in the first round of talks aimed at achieving a lasting peace agreement.
Is Shiba Inu dead or just in a crisis? The data behind SHIB's 95% crash

SHIB, the dog-themed meme coin that became one of the biggest success stories in crypto and turned early buyers into crypto millionaires, is facing tough times. Its price has fallen more than 32% so far this year, and it is down 95% from its all-time high in 2021. Is SHIB simply another fading meme coin, or is the market overlooking a possible recovery story?

Regime change: Inside Kevin Warsh's first move to make the Fed unreadable on purpose

The rate did not move. That was the least interesting thing about Kevin Warsh's first meeting in charge of the Fed. The FOMC held its benchmark at 3.50%-3.75% for the fourth straight meeting, exactly as priced, and then the new chair used his first press conference to dismantle the machinery the market has leaned on for a decade.