- NZD/JPY fell 0.27% on Friday, trading near the 90.30 level.
- Pair tallied a 3-day losing streak and seems to be scaping the 90.00-92.00 range to the downside.
- RSI and MACD bearish, signaling potential further losses toward 90.00.
The NZD/JPY pair has been on a downward trajectory for the past three days, shedding 0.27% on Friday's session to close near the 90.30 level. This losing streak has seemingly broken the 90.00-92.00 range, with further losses possible.
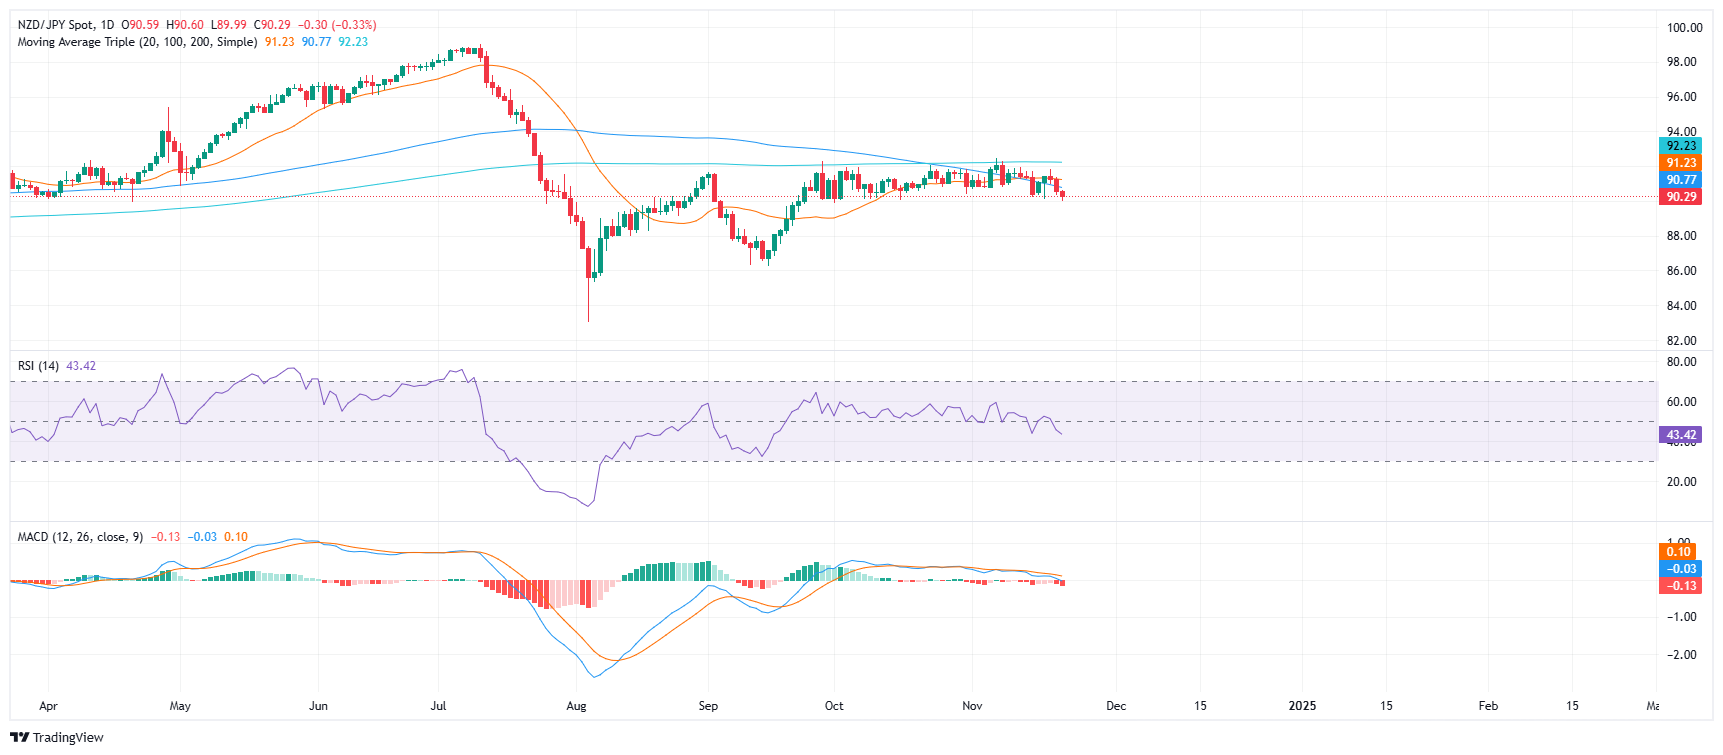
The bearish outlook is supported by the Moving Average Convergence Divergence (MACD), which indicates a sell signal, and the Relative Strength Index (RSI), which is below 50 and declining, signaling increasing selling pressure.
NZD/JPY's three-day decline eyes to break the 90.00-92.00 range and the outlook could worsen if the pair loses further towards 90.00. Key resistance levels lie ahead at 90.50 and 90.60, while support can be anticipated at 89.90 and 89.70
NZD/JPY daily chart
Information on these pages contains forward-looking statements that involve risks and uncertainties. Markets and instruments profiled on this page are for informational purposes only and should not in any way come across as a recommendation to buy or sell in these assets. You should do your own thorough research before making any investment decisions. FXStreet does not in any way guarantee that this information is free from mistakes, errors, or material misstatements. It also does not guarantee that this information is of a timely nature. Investing in Open Markets involves a great deal of risk, including the loss of all or a portion of your investment, as well as emotional distress. All risks, losses and costs associated with investing, including total loss of principal, are your responsibility. The views and opinions expressed in this article are those of the authors and do not necessarily reflect the official policy or position of FXStreet nor its advertisers. The author will not be held responsible for information that is found at the end of links posted on this page.
If not otherwise explicitly mentioned in the body of the article, at the time of writing, the author has no position in any stock mentioned in this article and no business relationship with any company mentioned. The author has not received compensation for writing this article, other than from FXStreet.
FXStreet and the author do not provide personalized recommendations. The author makes no representations as to the accuracy, completeness, or suitability of this information. FXStreet and the author will not be liable for any errors, omissions or any losses, injuries or damages arising from this information and its display or use. Errors and omissions excepted.
The author and FXStreet are not registered investment advisors and nothing in this article is intended to be investment advice.
Recommended content
Editors’ Picks

EUR/USD looks range bound in the sub-1.1600 area
Following Wednesday's hiccup, EUR/USD resumes its weekly downturn, remaining in the sub-1.1600 range, while the US Dollar (USD) gains momentum across the board on the back of solid retail sales numbers and the weekly labour market report.

GBP/USD remains on the defensive around 1.3400
GBP/USD maintains its bearish tilt unachanged toward the end of Thursday’s session, hovering just above recent multi-week lows around the .3400 neighbourhood. The positive UK labour market statistics offered instant support for the British Pound, but the strong tone in the Greenback kept Cable’s price action subdued.

Gold trades with modest losses near $3,340
Gold remains in auto-pilot around the $3,340 zone per troy ounce as the NA session draws to a close on Thursday. The yellow metal's negative trend stems from the extra improvement in the dollar, rising US yields, and some relief from trade concerns.

Top Crypto Gainers: FLOKI, BONK post double-digit gains, CRV targets $1
Solana-based meme coins Floki and Bonk edged lower by 2% at press time on Thursday, following the 30% gains on Wednesday, ranking as top crypto gainers in the last 24 hours. Curve DAO ranks third with a 21% surge following a triangle setup breakout, targeting the $1 psychological level.

China’s first-half growth remains on track, though activity data signals caution
China's second-quarter GDP beat forecasts again with a 5.2% year-on-year growth, driven by strong trade and industrial production. Yet sharper-than-expected slowdowns in fixed-asset investment and retail sales and falling property prices are a concern.

Best Brokers for EUR/USD Trading
SPONSORED Discover the top brokers for trading EUR/USD in 2025. Our list features brokers with competitive spreads, fast execution, and powerful platforms. Whether you're a beginner or an expert, find the right partner to navigate the dynamic Forex market.