|

NZD/JPY Price Analysis: Mixed technical outlook with sideways movement

  • NZD/JPY has been trading sideways recently, with mixed signals from technical indicators.
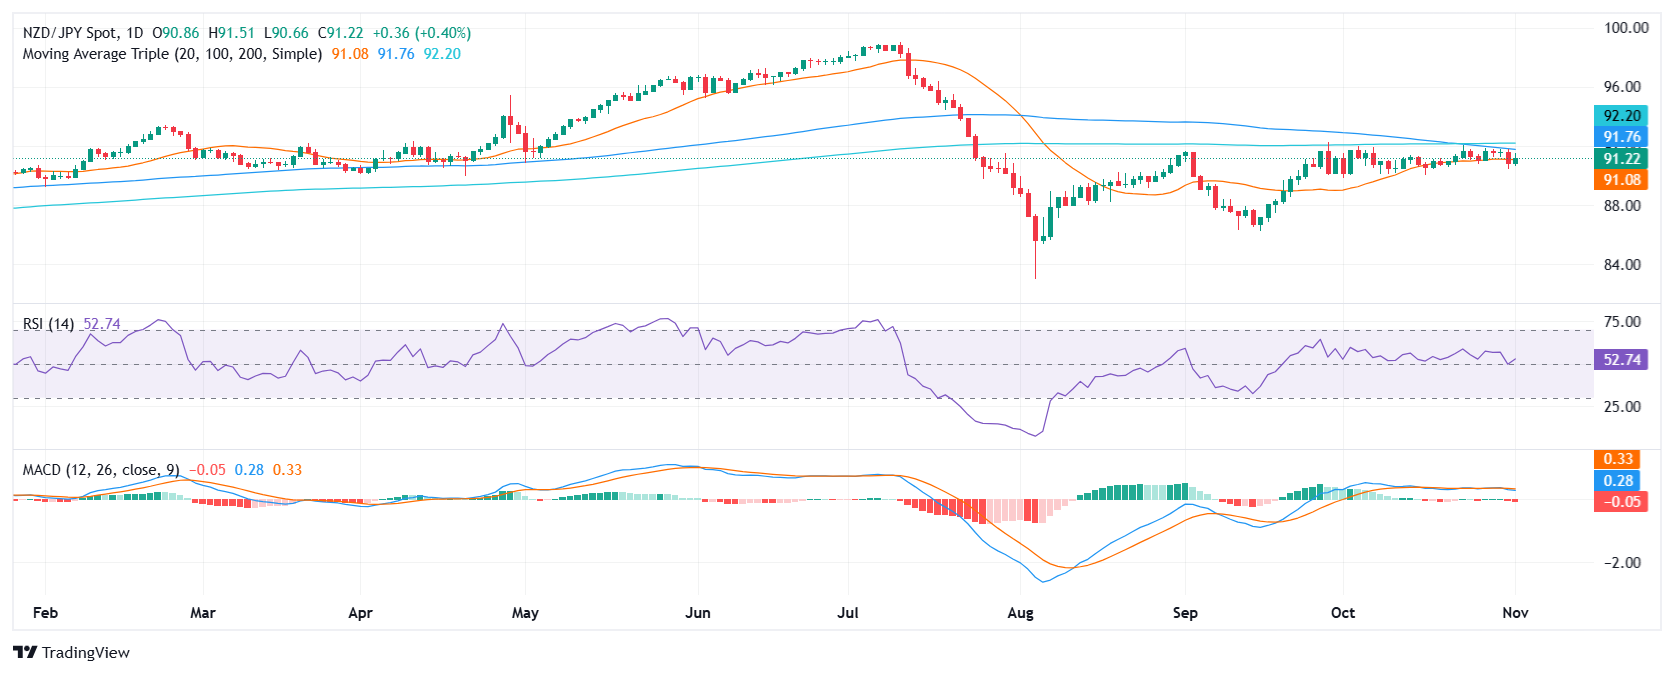
  • The pair is currently supported at 90.70 and faces resistance at 91.90.
  • There are some signs of bearish momentum mounting which could threaten the 20-day SMA.

Friday's trading saw the NZD/JPY pair continue its sideways movement of the past sessions. The pair exhibits a range-bound pattern with no significant upward or downward spikes. By the end of the week the cross mildly rose to 91.20, but the outlook remains neutral.

Technical indicators provide mixed signals regarding the NZD/JPY's future direction. The Relative Strength Index (RSI) sits at 53, indicating positive territory for the pair. The upward slope of the RSI suggests a steady buying pressure. However, the Moving Average Convergence Divergence (MACD) shows signs of increasing selling pressure, with rising red bars in the histogram. 

Support levels lie at 91.00 (20-day Simple Moving Average (SMA)), 90.70, and 90.50. Conversely, resistance levels are found at 91.30, 91.50, and 91.70. These levels define the range within which the NZD/JPY has been trading recently.

NZD/JPY Daily chart

Author

Patricio Martín

Patricio is an economist from Argentina passionate about global finance and understanding the daily movements of the markets.

More from Patricio Martín
Share:

Markets move fast. We move first.

Orange Juice Newsletter brings you expert driven insights - not headlines. Every day on your inbox.

By subscribing you agree to our Terms and conditions.

Editor's Picks

EUR/USD holds above 1.1750 due to cautious trade before FOMC Minutes

EUR/USD holds ground after four days of little losses, trading around 1.1770 during the Asian hours on Tuesday. The pair remains steady as US Dollar moves little amid market caution ahead of the Federal Open Market Committee December Meeting Minutes due later in the day, which could offer insights into the Federal Reserve’s 2026 outlook.

GBP/USD finds key support near 1.35 despite year-end grind

GBP/USD remains bolstered on the high end as markets grind through the last trading week of the year. Cable caught a bullish tilt to keep price action on the high side of the 1.3500 handle, though year-end holiday volumes are unlikely to see significant progress in either direction as 2025 draws to a close.

Gold rises on Fed rate cut bets, safe-haven flows

Gold price edges higher above $4,350 during the early European trading hours on Tuesday. The precious metal recovers some lost ground after falling 4.5% in the previous session, which was gold's largest single-day loss since October.  Increased margin requirements on gold and silver futures by the Chicago Mercantile Exchange Group, one of the world’s largest trading floors for commodities, prompted widespread profit-taking and portfolio rebalancing.

Solana risks correction within descending wedge as bearish bets rise

Solana hovers above $120 at press time on Tuesday after a nearly 2% decline on Monday. The SOL-focused Exchange Traded Funds see renewed interest after recording their lowest weekly inflow last week.

Economic outlook 2026-2027 in advanced countries: Solidity test

After a year marked by global economic resilience and ending on a note of optimism, 2026 looks promising and could be a year of solid economic performance. In our baseline scenario, we expect most of the supportive factors at work in 2025 to continue to play a role in 2026.

Crypto market outlook for 2026

Year 2025 was volatile, as crypto often is.  Among positive catalysts were favourable regulatory changes in the U.S., rise of Digital Asset Treasuries (DAT), adoption of AI and tokenization of Real-World-Assets (RWA).