|

NZD/JPY Price Analysis: Fresh sell-off signals deeper downside potential

  • NZD/JPY slipped to around 87.00 in a renewed wave of selling.
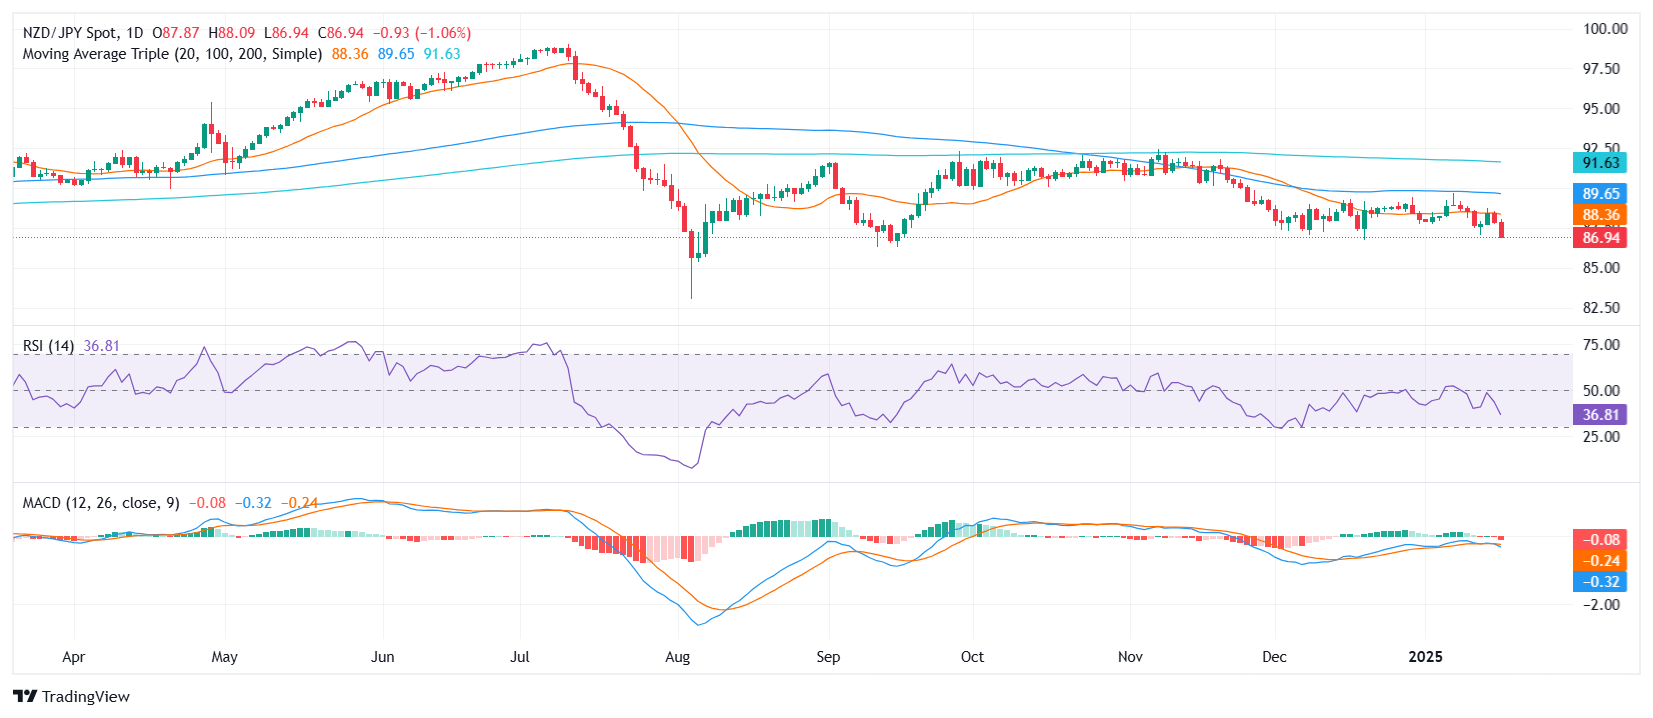
  • RSI plunges, reinforcing the pair’s tilt toward sustained bearish momentum.
  • MACD histogram prints rising red bars, hinting that sellers may remain in control for now.

The NZD/JPY cross found itself under renewed pressure on Thursday, sliding 0.84% to around 87.05. Persistent selling has kept the pair pinned to lower levels, erasing gains from earlier this week. The swift downside move suggests that market participants remain inclined to sell on any short-lived rebounds, effectively tilting the near-term tone toward negativity.

In terms of technical indicators, the Relative Strength Index (RSI) has declined sharply to 37, emphasizing building downside momentum. Meanwhile, the Moving Average Convergence Divergence (MACD) histogram shows rising red bars, underscoring that sellers are retaining their grip. Combined, these signals point to a cautious backdrop where buyers may hesitate to reenter aggressively.

Looking ahead, immediate support appears near the 86.80–87.00 region, with a break below this zone potentially opening the door toward 86.50 or lower. On the flip side, if bulls manage to drive NZD/JPY above the 87.70 pivot, it could spark a modest recovery, though the overall bias would likely stay negative unless the pair can reclaim the 88.00 handle with conviction.

NZD/JPY daily chart

Author

Patricio Martín

Patricio is an economist from Argentina passionate about global finance and understanding the daily movements of the markets.

More from Patricio Martín
Share:

Markets move fast. We move first.

Orange Juice Newsletter brings you expert driven insights - not headlines. Every day on your inbox.

By subscribing you agree to our Terms and conditions.

Editor's Picks

EUR/USD trades around 1.1700 after rebounding from 50-day EMA

EUR/USD gains ground after three days of losses, trading around 1.1700 during the Asian hours on Wednesday. On the daily chart, technical analysis indicates a potential for a bearish bias; the 14-day Relative Strength Index at 47 confirms waning momentum.

GBP/USD climbs above 1.3500 as US Dollar weakens ahead of ISM Services PMI

GBP/USD gains some ground after registering modest gains in the previous session, trading around 1.3510 during the Asian hours on Wednesday. The pair edges higher as the US Dollar struggles ahead of the US ISM Services Purchasing Managers’ Index and JOLTs job openings due later in the day.

Gold pulls back from $4,500 amid profit-taking ahead of key US macro data

Gold struggles to capitalize on its strong weekly gains registered over the past two days and faces rejection near the $4,500 psychological mark, or over a one-week high touched during the Asian session on Wednesday. As investors digest the recent US attack on Venezuela, the prevalent risk-on environment prompts some profit-taking around the commodity. 

Bitcoin, Ethereum and Ripple cool off as rally stalls near key resistance zones

Bitcoin, Ethereum, and Ripple prices are taking a breather on Wednesday near their key resistance levels following the recent surge. BTC faces rejection at the $94,253 level, while ETH and XRP follow BTC’s footsteps, struggling near $3,308 and $2.35, respectively.

Implications of US intervention in Venezuela

Events in Venezuela are top of mind for market participants, and while developments are associated with an elevated degree of uncertainty, we are not making any changes to our markets or economic forecasts as a result of the deposition of Nicolás Maduro. 

Cardano holds steady as bulls intensify push for breakout

Cardano rises above the 50-day EMA resistance amid a risk-on mood across the crypto market. The MACD upholds positive divergence, increasing the potential for a 20% breakout to $0.505.