|

NZD/JPY Price Analysis: Bears take control conquering key level, hourly chart signals oversold conditions

  • The NZD/JPY is currently trading at around 91.20, recording a 0.73% decrease in Thursday's session.
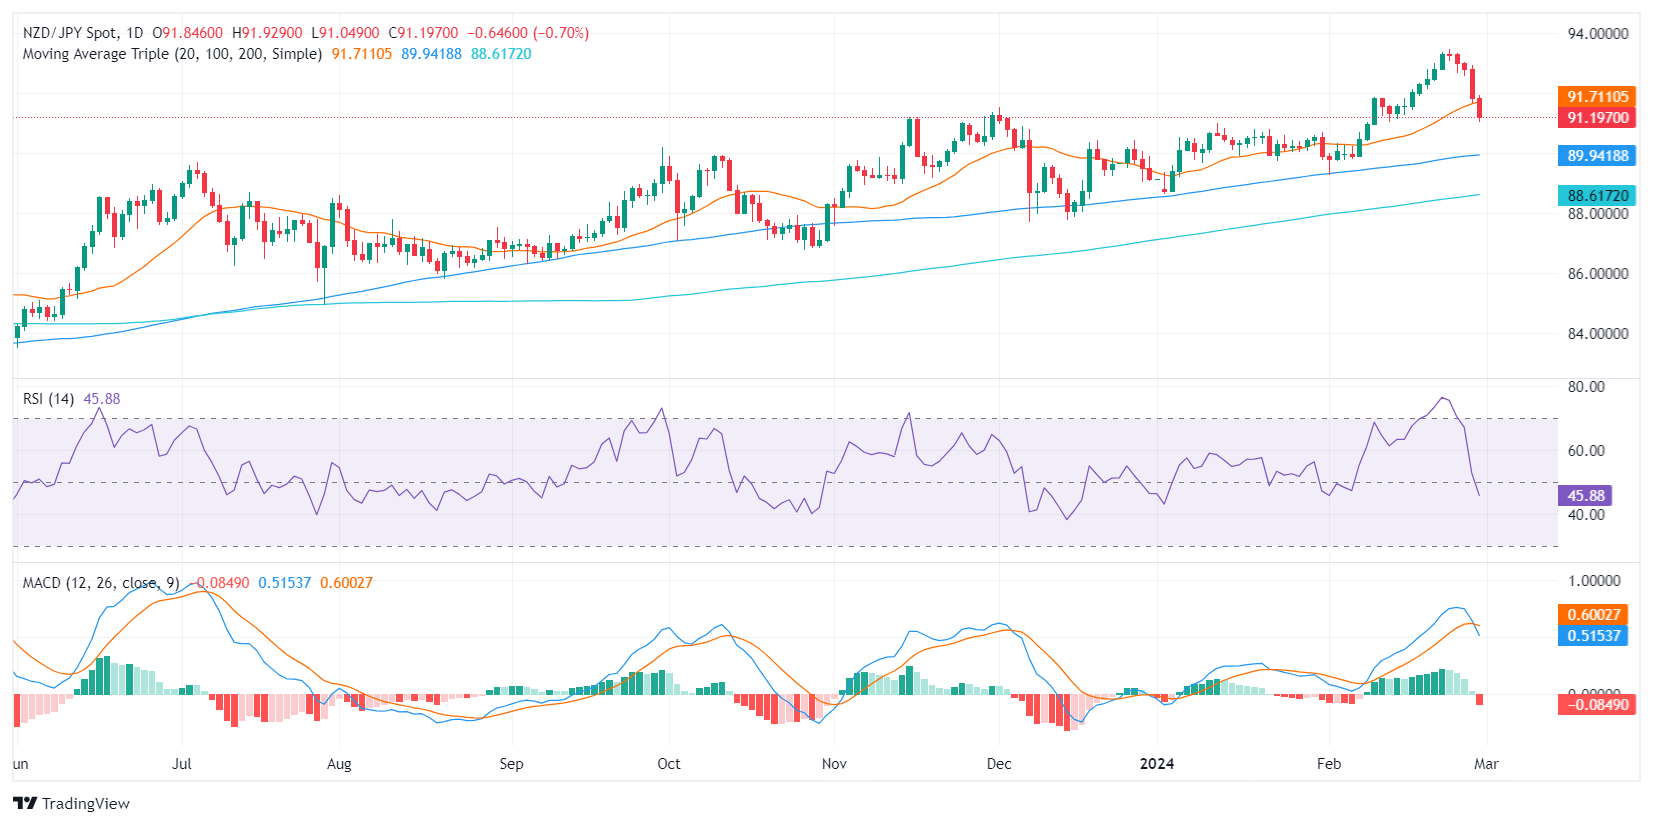
  • Based on the daily chart, RSI suggests a shift from a bullish to a bearish area.
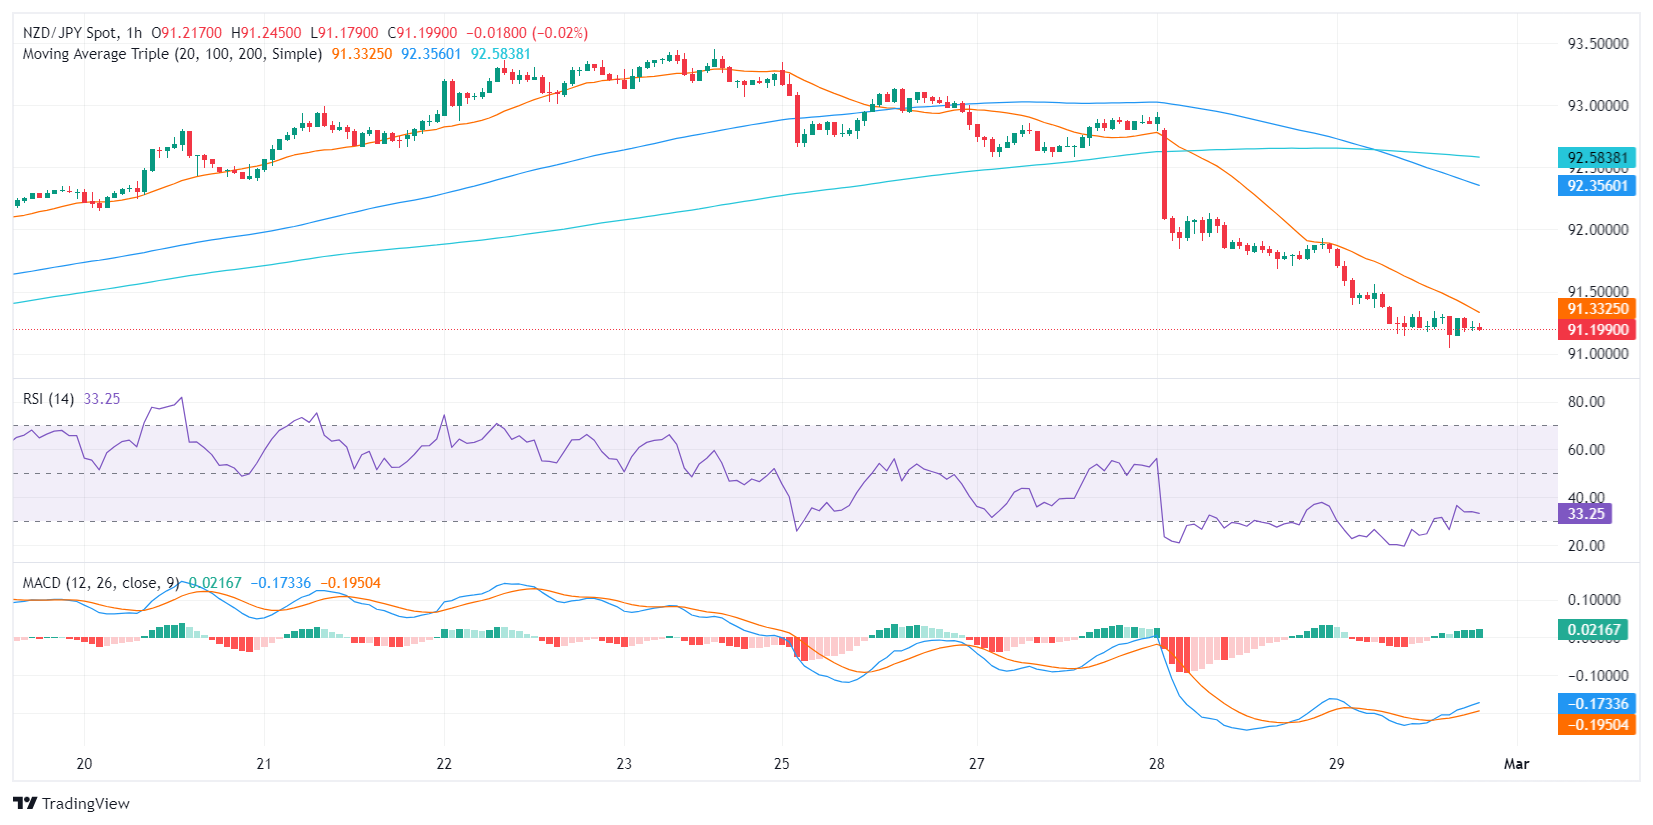
  • A closer look at the hourly chart underlines the intensified selling pressure with the RSI residing near oversold territory.
  • Despite these short-term bearish signals, the NZD/JPY is still operating above main SMAs suggesting a continued influence from long-term bullish buyers.

In Thursday's session, the NZD/JPY pair is trading substantially lower at around the 91.20 level, implying a potent selling momentum marking a 0.73% decrease on the day. Despite the immediate downward inclination, the pair maintains its stance in a broader bullish territory as long-term buyers retain control and these movements could be considered as a consolidation phase after reaching multi-year highs.

Based on the daily Relative Strength Index (RSI), the pair has recently fallen from positive territories into negative. Yet, before this transposition, the pair spent considerable time in overbought territories, which could indicate profit-taking movements. Turning now to the Moving Average Convergence Divergence (MACD) histogram, an uninterrupted sequence of increasing red bars is seen. These highlight an expansion in negative momentum, suggesting that sellers are currently dictating the market dynamics.

NZD/JPY daily chart

Shifting focus to the hourly chart, the RSI is noticeably near the oversold territories revealing how the selling pressure has accelerated. This is further strengthened when topped by the continuous red bars on the MACD in the hourly chart cementing the argument for the increased selling pace.

NZD/JPY hourly chart

Despite the bearish signals from the daily and hourly charts, the pair is still in broader bullish territory as it lies above the 100 and 200-day Simple Moving Averages (SMAs), showing that long-term buyers are still in command. This discrepancy could imply a temporary bearish correction within an overall bullish trend ordained by the alignment of the SMAs.

NZD/JPY

Overview
Today last price91.24
Today Daily Change-0.60
Today Daily Change %-0.65
Today daily open91.84
 
Trends
Daily SMA2091.64
Daily SMA5090.68
Daily SMA10089.92
Daily SMA20088.59
 
Levels
Previous Daily High92.94
Previous Daily Low91.68
Previous Weekly High93.45
Previous Weekly Low91.91
Previous Monthly High90.99
Previous Monthly Low88.64
Daily Fibonacci 38.2%92.16
Daily Fibonacci 61.8%92.46
Daily Pivot Point S191.37
Daily Pivot Point S290.89
Daily Pivot Point S390.11
Daily Pivot Point R192.63
Daily Pivot Point R293.42
Daily Pivot Point R393.89

Author

Patricio Martín

Patricio is an economist from Argentina passionate about global finance and understanding the daily movements of the markets.

More from Patricio Martín
Share:

Markets move fast. We move first.

Orange Juice Newsletter brings you expert driven insights - not headlines. Every day on your inbox.

By subscribing you agree to our Terms and conditions.

Editor's Picks

EUR/USD rebounds after falling toward 1.1700

EUR/USD gains traction and trades above 1.1730 in the American session, looking to end the week virtually unchanged. The bullish opening in Wall Street makes it difficult for the US Dollar to preserve its recovery momentum and helps the pair rebound heading into the weekend.

GBP/USD steadies below 1.3400 as traders assess BoE policy outlook

Following Thursday's volatile session, GBP/USD moves sideways below 1.3400 on Friday. Investors reassess the Bank of England's policy oıtlook after the MPC decided to cut the interest rate by 25 bps by a slim margin. Meanwhile, the improving risk mood helps the pair hold its ground.

Gold stays below $4,350, looks to post small weekly gains

Gold struggles to gather recovery momentum and stays below $4,350 in the second half of the day on Friday, as the benchmark 10-year US Treasury bond yield edges higher. Nevertheless, the precious metal remains on track to end the week with modest gains as markets gear up for the holiday season.

Crypto Today: Bitcoin, Ethereum, XRP rebound amid bearish market conditions

Bitcoin (BTC) is edging higher, trading above $88,000 at the time of writing on Monday. Altcoins, including Ethereum (ETH) and Ripple (XRP), are following in BTC’s footsteps, experiencing relief rebounds following a volatile week.

How much can one month of soft inflation change the Fed’s mind?

One month of softer inflation data is rarely enough to shift Federal Reserve policy on its own, but in a market highly sensitive to every data point, even a single reading can reshape expectations. November’s inflation report offered a welcome sign of cooling price pressures. 

XRP rebounds amid ETF inflows and declining retail demand demand

XRP rebounds as bulls target a short-term breakout above $2.00 on Friday. XRP ETFs record the highest inflow since December 8, signaling growing institutional appetite.