NZD/JPY Price Analysis: Bears push slightly down, testing support at 89.70
- NZD/JPY declined on Tuesday's session to settle around 89.70.
- The RSI is hovering near the 50 midline, suggesting a neutral bias.
- The MACD is flat green, indicating a lack of clear momentum.

The NZD/JPY currency pair is facing renewed selling pressure on Tuesday, declining by 0.30% to trade around 89.70. Technical indicators display mixed signals, suggesting that the pair is likely to remain range-bound in the near term.
The Relative Strength Index (RSI) is fluctuating around the 50 midline at 46, indicating that neither buyers nor sellers have a clear advantage. This reading suggests that the pair is likely to continue its sideways movement within the current range. The Moving Average Convergence Divergence (MACD) is also showing a neutral bias, with flat green bars indicating that the bullish momentum is neither gaining nor losing strength.
NZD/JPY daily chart
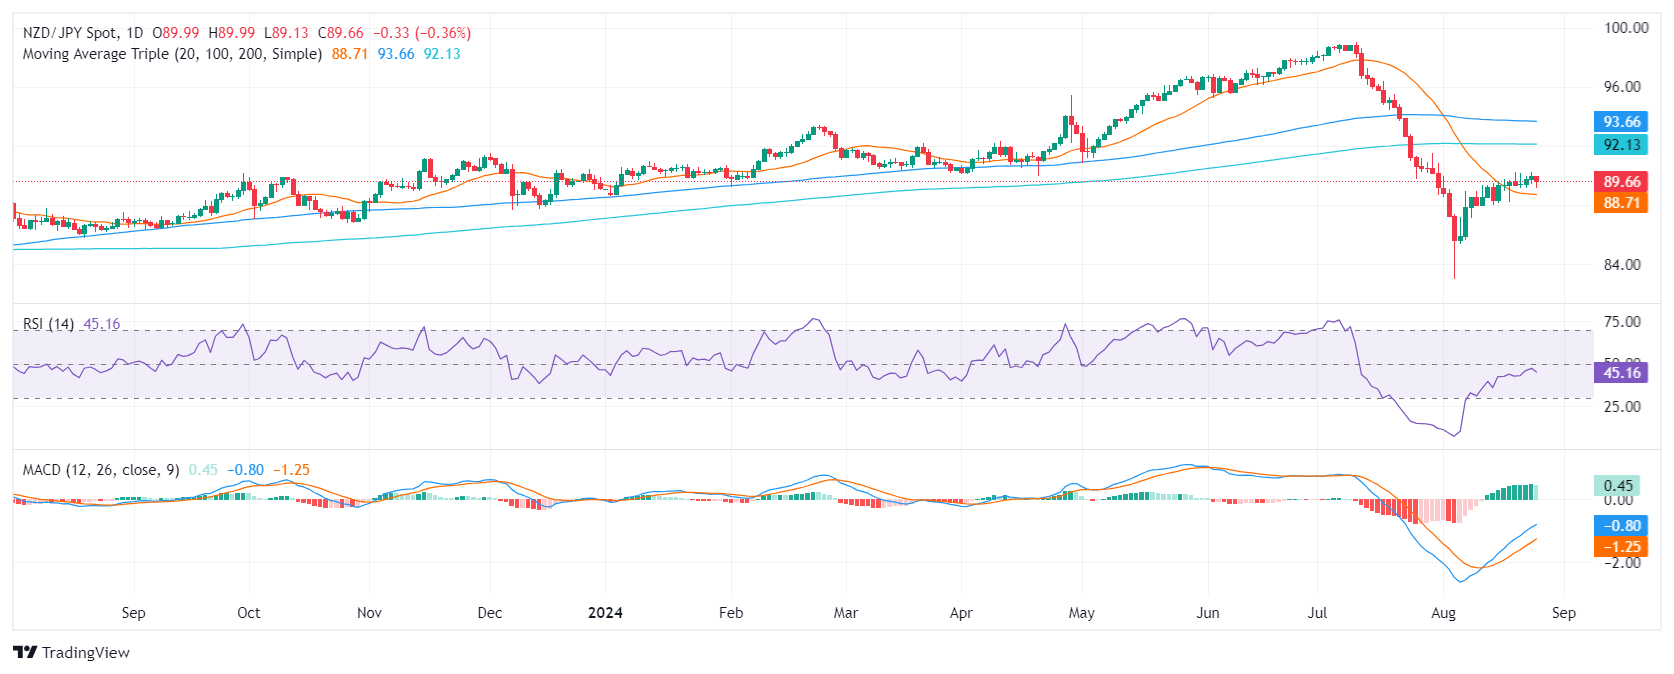
As the pair seems to be stuck in a consolidation period and with indicators flat, the cross might continue trading in the 88.00-90.00 channel. A break above or below these levels might set the pace for the short term.
Author

Patricio Martín
FXStreet
Patricio is an economist from Argentina passionate about global finance and understanding the daily movements of the markets.


