|

NZD/JPY Price Analysis: Bearish momentum strengthens as sellers reclaim the 20-day SMA

  • The daily chart of the NZD/JPY indicates a weakening momentum, with RSI and MACD signifying rising selling pressure.
  • The NZD/JPY plunged below the crucial short-term 20-day SMA, hinting at immediate bearish prospects.
  • Despite recent bearish actions, the long-term outlook continues to favor buyers.

The NZD/JPY declined to 91.00, down by 0.27% on Friday. Bears are quietly gaining ground conquering the 20-day Simple Moving Average (SMA) and the selling traction is mounting. On the broader outlook, the trend is still bullish.

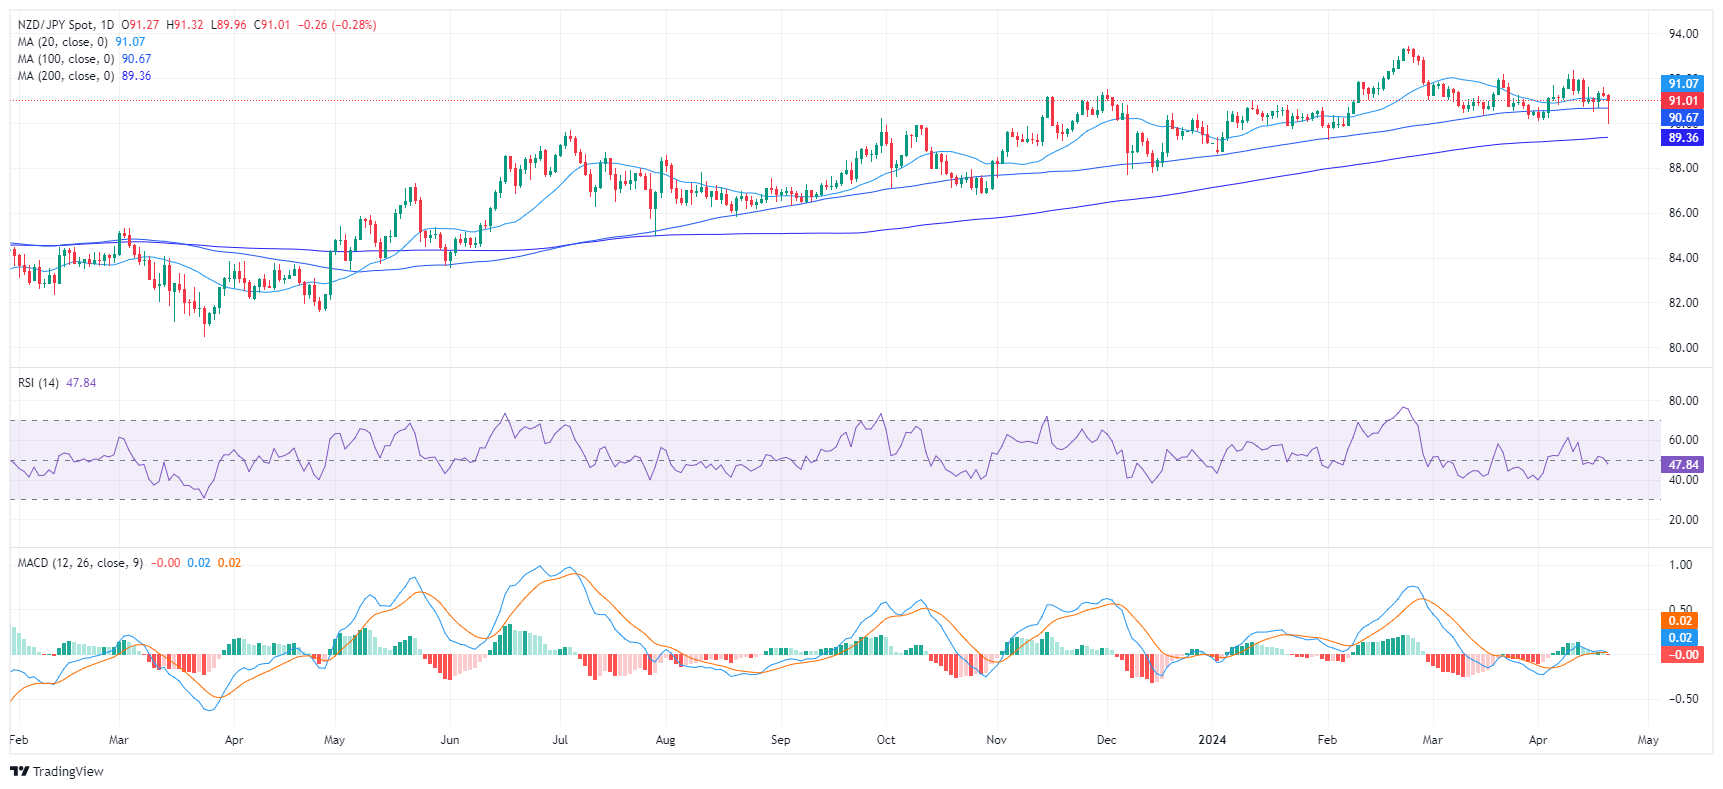
On the daily chart, the Relative Strength Index (RSI) pair reveals a recent drift into negative territory towards 47, indicating weakening momentum. Likewise, the Moving Average Convergence Divergence (MACD) paints a similar picture with a fresh red bar, signaling a growing bearish momentum. These indicators collectively imply sellers' dominance in the current market scenario.

NZD/JPY daily chart

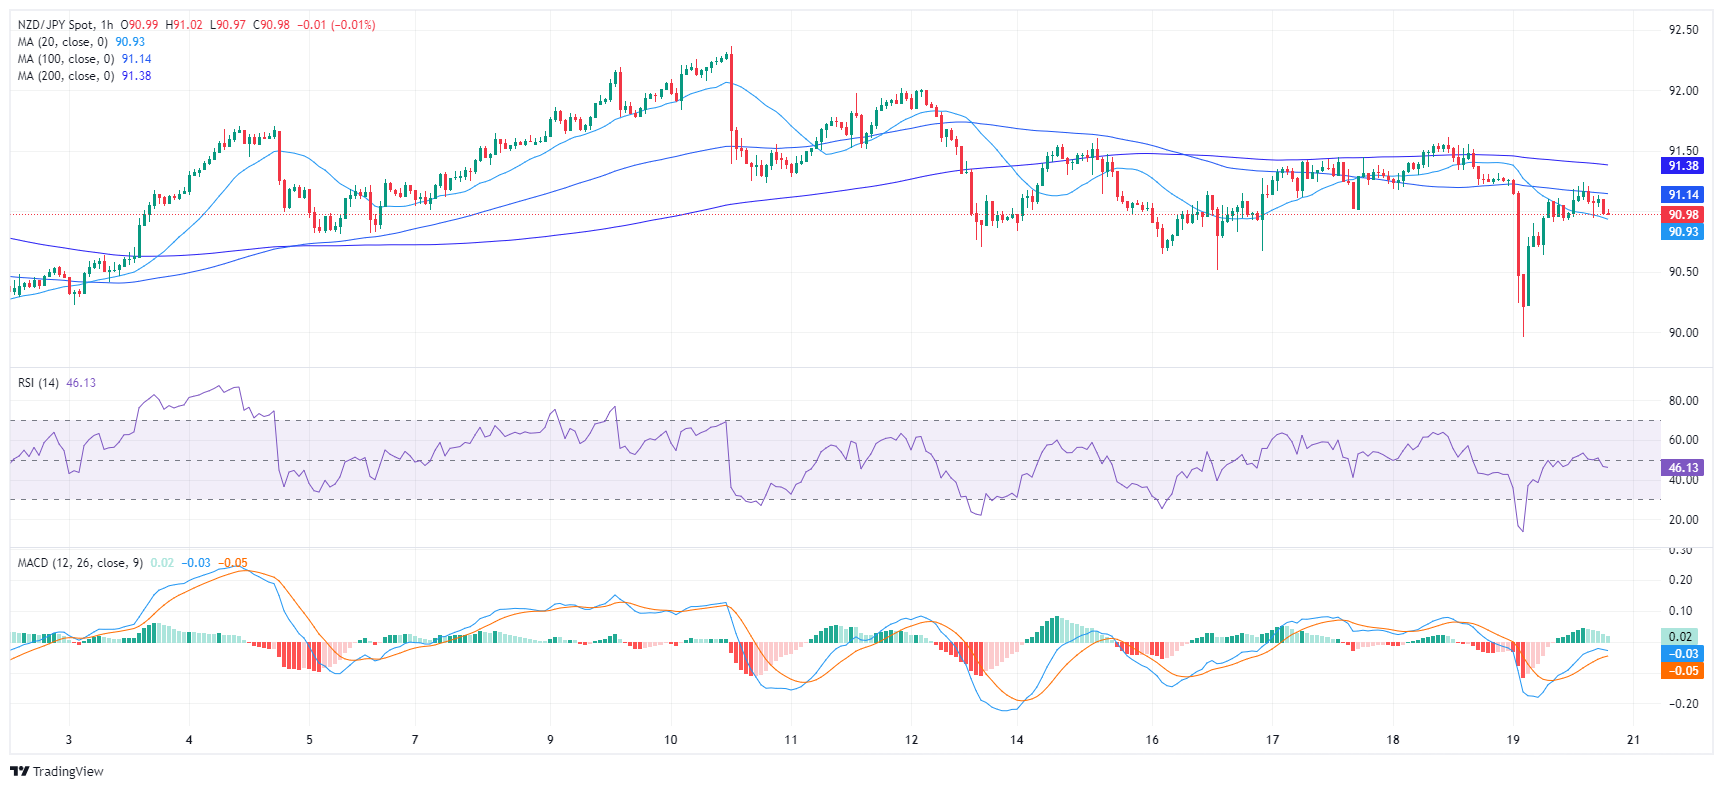
Upon examining the hourly chart, the RSI stands below its middle points, also adding arguments for a negative short-term outlook. In addition, the MACD histogram is printing decreasing green bars a clear indication of diminishing bullish momentum.

NZD/JPY hourly chart

When turning the lens to the broader landscape, NZD/JPY underwent substantial changes on Friday. The pair sunk beneath the 20-day Simple Moving Average (SMA), a significant short-term technical indicator, thus potentially establishing a bearish outlook in the immediate future. Despite this, the pair has managed to maintain its position above the 100-day and 200-day SMAs, revealing sustained bullish momentum over a more extended period. That being said, as bears gather ground, they might make a stride toward the 100-day SMA at around 90.60 which in case of conquering it, would worsen the outlook for the pair.

NZD/JPY

Overview
Today last price90.99
Today Daily Change-0.28
Today Daily Change %-0.31
Today daily open91.27
 
Trends
Daily SMA2091.05
Daily SMA5091.44
Daily SMA10090.67
Daily SMA20089.35
 
Levels
Previous Daily High91.62
Previous Daily Low91.18
Previous Weekly High92.37
Previous Weekly Low90.7
Previous Monthly High92.2
Previous Monthly Low90.17
Daily Fibonacci 38.2%91.35
Daily Fibonacci 61.8%91.45
Daily Pivot Point S191.09
Daily Pivot Point S290.92
Daily Pivot Point S390.66
Daily Pivot Point R191.53
Daily Pivot Point R291.79
Daily Pivot Point R391.96

Author

Patricio Martín

Patricio is an economist from Argentina passionate about global finance and understanding the daily movements of the markets.

More from Patricio Martín
Share:

Markets move fast. We move first.

Orange Juice Newsletter brings you expert driven insights - not headlines. Every day on your inbox.

By subscribing you agree to our Terms and conditions.

Editor's Picks

EUR/USD tests 1.1800, closes in on a fresh two-month high

EUR/USD extends its gains for the second consecutive day on Tuesday and trades near 1.1800. The broad-based US Dollar weakness and a potential policy divergence between the European Central Bank and the Federal Reserve keep the bullish bias intact heading into the holiday season.

GBP/USD climbs above 1.3500 area, renews 11-week peak

GBP/USD extends its weekly rally and trades at its highest level since early October above 1.3500. The US Dollar remains under persistent bearish pressure heading into the Christmas break, while Pound traders largely brush off the latest interest rate cut from the Bank of England.

Gold approaches $4,500 as record-setting rally continues

Gold builds on Monday's impressive gains and advances toward $4,500, setting fresh record-highs along the way. Heightened geopolitical tensions, combined with the ongoing US Dollar (USD) selloff ahead of the Q3 GDP data, help XAU/USD preserve its bullish momentum.

Crypto Today: Bitcoin, Ethereum, XRP decline as risk-off sentiment escalates

Bitcoin remains under pressure, trading above the $87,000 support at the time of writing on Tuesday. Selling pressure has continued to weigh on the broader cryptocurrency market since Monday, triggering declines across altcoins, including Ethereum and Ripple.

Ten questions that matter going into 2026

2026 may be less about a neat “base case” and more about a regime shift—the market can reprice what matters most (growth, inflation, fiscal, geopolitics, concentration). The biggest trap is false comfort: the same trades can look defensive… right up until they become crowded.

XRP steadies above $1.90 support as fund inflows and retail demand rise

Ripple (XRP) is stable above support at $1.90 at the time of writing on Monday, after several attempts to break above the $2.00 hurdle failed to materialize last week. Meanwhile, institutional interest in the cross-border remittance token has remained steady.