NZD/JPY Price Analysis: Bearish bias prevails as technical indicators remain flat


  • NZD/JPY mildly declined in Tuesday's session, landing at 89.40.
  • The RSI flattened around 40, indicating a potential bearish trend while the MACD remains neutral with green bars, suggesting a lack of clear momentum.
  • The pair continues trading within a range of 87.50 and 90.50.

The NZD/JPY currency pair has experienced continued sideways trading despite Tuesday's modest decline of 0.15%, settling at 89.40. Technical indicators paint a mixed picture, with the Relative Strength Index (RSI) and the Moving Average Convergence Divergence (MACD) hinting at mild a bearish bias.

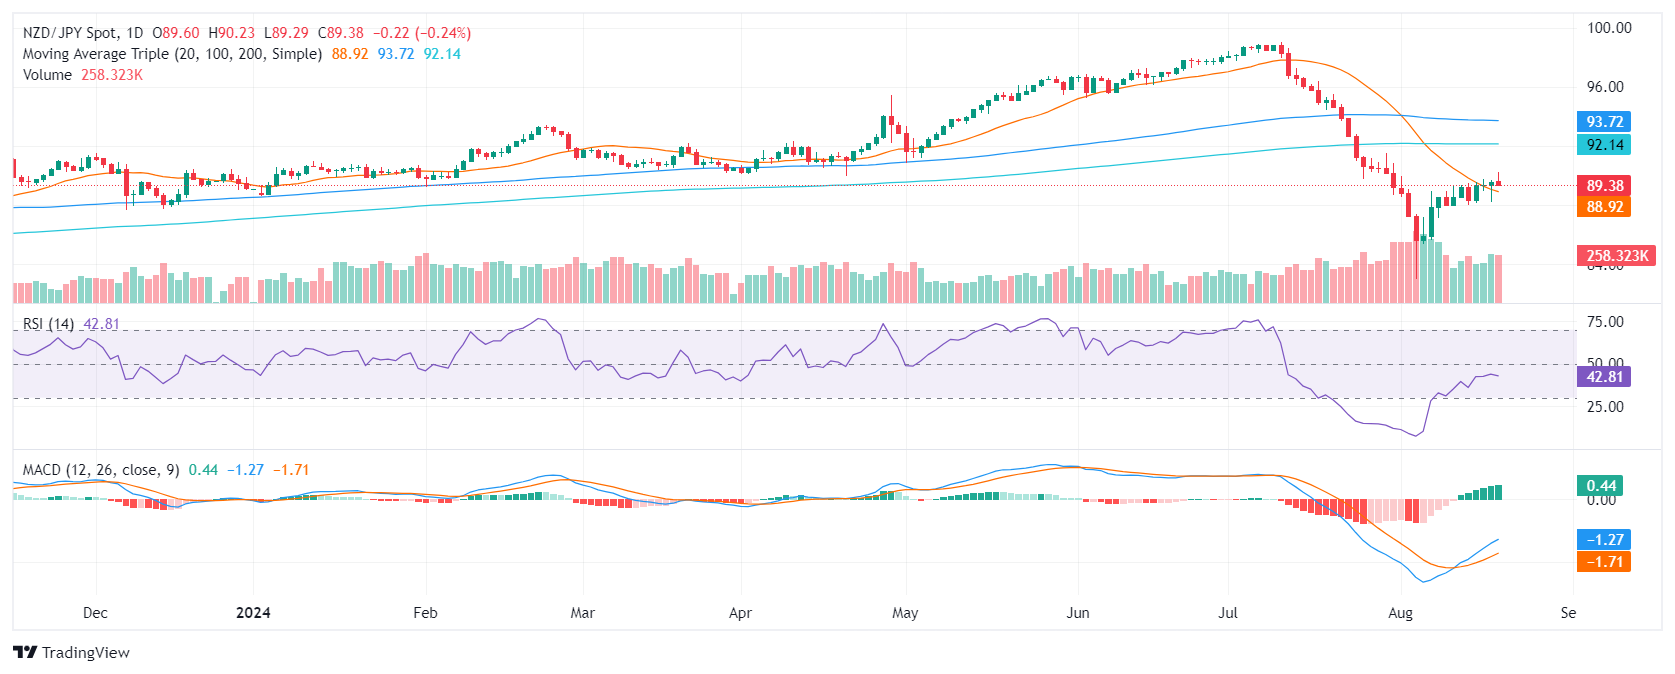
The RSI remains neutral around 42, suggesting that the bears are present. If the RSI continues to move below, it would indicate a potential strong bearish reversal. The MACD is showing flat green bars, suggesting that there is no clear momentum in either direction. For the MACD, if the flat green bars progress to red bars, it will suggest increasing bearish momentum and a potential strong reversal.

Volume has been consistently low, indicating a lack of conviction in the recent price movements. The pair is currently trading within a range between 87.50 and 90.50. A break below 87.50 could lead to further declines towards 86.00, while a break above 90.50 could push the pair up to 92.00.
 

NZD/JPY Daily chart

Share: Feed news

Information on these pages contains forward-looking statements that involve risks and uncertainties. Markets and instruments profiled on this page are for informational purposes only and should not in any way come across as a recommendation to buy or sell in these assets. You should do your own thorough research before making any investment decisions. FXStreet does not in any way guarantee that this information is free from mistakes, errors, or material misstatements. It also does not guarantee that this information is of a timely nature. Investing in Open Markets involves a great deal of risk, including the loss of all or a portion of your investment, as well as emotional distress. All risks, losses and costs associated with investing, including total loss of principal, are your responsibility. The views and opinions expressed in this article are those of the authors and do not necessarily reflect the official policy or position of FXStreet nor its advertisers. The author will not be held responsible for information that is found at the end of links posted on this page.

If not otherwise explicitly mentioned in the body of the article, at the time of writing, the author has no position in any stock mentioned in this article and no business relationship with any company mentioned. The author has not received compensation for writing this article, other than from FXStreet.

FXStreet and the author do not provide personalized recommendations. The author makes no representations as to the accuracy, completeness, or suitability of this information. FXStreet and the author will not be liable for any errors, omissions or any losses, injuries or damages arising from this information and its display or use. Errors and omissions excepted.

The author and FXStreet are not registered investment advisors and nothing in this article is intended to be investment advice.

Recommended content


Recommended content

Editors’ Picks

EUR/USD bounces off lows, back near 1.1330

EUR/USD bounces off lows, back near 1.1330

EUR/USD meets daily support around the 1.1300 neighbourhood, managing to regain pace and revisit the 1.1330 region. Sentiment turned after President Trump proposed a “straight 50% tariff” on European imports, undermining the pair’s bullish momentum.

GBP/USD eases from tops, revisits the 1.3500 zone

GBP/USD eases from tops, revisits the 1.3500 zone

GBP/USD benefits from broad US Dollar weakness, climbing to its highest level since February 2022 past 1.3500 at the end of the week. UK retail sales data surprised to the upside in April, lending extra wings to the quid.

Gold keeps the bullish tone near $3,350

Gold keeps the bullish tone near $3,350

Gold extends its weekly advance, trading around $3,350 per troy ounce on Friday. The rally in XAU/USD is driven by broad-based weakness in the Greenback, particulalry after President Trump’s threat to impose 50% tariffs on European imports.

Apple stock sinks below $200 after Trump threatens more tariffs

Apple stock sinks below $200 after Trump threatens more tariffs Premium

Trump grows irate at Apple's move into India. President claims Apple must produce US-sold iPhone in US or face a 25% tariff. US equity futures slip more than 1% in Friday premarket after Trump threatens the EU with a 50% tariff.

Ripple Price Prediction: Whale accumulation sparks hope as rising exchange reserves signal caution

Ripple Price Prediction: Whale accumulation sparks hope as rising exchange reserves signal caution

XRP sustains mid-week recovery as XRP/BTC flashes golden cross for the first time since 2017. Large volume holders increase XRP exposure, indicating rising demand and investor confidence.

The Best brokers to trade EUR/USD

The Best brokers to trade EUR/USD

SPONSORED Discover the top brokers for trading EUR/USD in 2025. Our list features brokers with competitive spreads, fast execution, and powerful platforms. Whether you're a beginner or an expert, find the right partner to navigate the dynamic Forex market.

Forex MAJORS

Cryptocurrencies

Signatures

Best Brokers of 2025