|

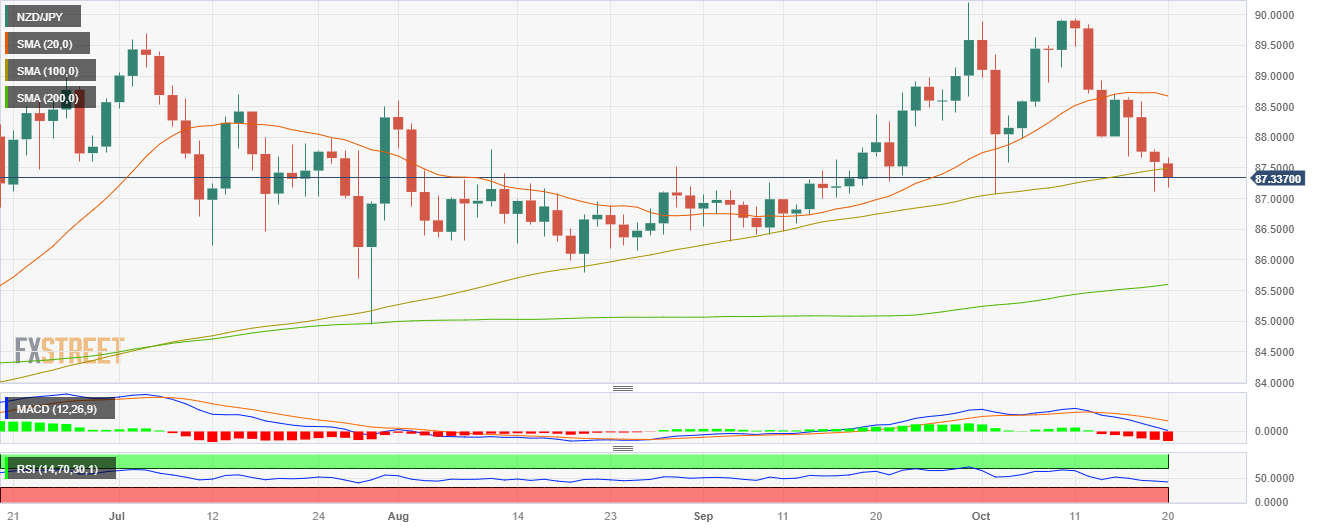
NZD/JPY falls below the 100-day SMA, towards 87.30

  • NZD/USD saw 0.30% losses declining near 87.30 .
  • The cross tallies a four-day losing streak and will close a 0.80% losing week.
  • For the first time since April, the pair trades below the 20 and 100-day SMA.

In Friday’s session, the NZD/JPY continued facing selling pressure, seeing losses for a fourth consecutive day. The bears breach the 100-day Simple Moving Average (SMA), and the outlook is starting to tilt in favour of the bears in the daily chart.The Relative Strength Index (RSI) exhibits a negative slope below the 50 threshold, approaching the oversold condition, while the Moving Average Convergence (MACD) histogram displays larger red bars. Furthermore, the pair is above the 20 and 100-day Simple Moving Averages (SMAs) but below the 200-day SMA, pointing out that the long-term trend currently favours the bulls.

The bearish sentiment is more evident on the four-hour chart, with indicators approaching oversold conditions and the RSI leaping towards the 30 area. That being said, a technical correction in the next sessions may be on the horizon, but in the short term, the sellers have the upperhand.

 Support levels: 87.122, 86.505, 86.300.

 Resistance levels: 87.500 (100-day SMA), 87.805, 88.300.

 NZD/JPY Daily Chart

Author

Patricio Martín

Patricio is an economist from Argentina passionate about global finance and understanding the daily movements of the markets.

More from Patricio Martín
Share:

Editor's Picks

AUD/USD falls to near 0.7100 after slipping below 50-day EMA

AUD/USD depreciates after registering minor gains in the previous day, trading around 0.7120 during the Asian hours. The technical analysis of the daily chart shows the pair consolidating sideways within a rectangle pattern, as neither bulls nor bears gain control. The AUD/USD pair is holding a slight bearish tone however as it sits beneath both the nine-day and 50-day EMAs.

USD/JPY consolidates near 160.00 as US NFP takes centre stage

The USD/JPY pair trades in a tight range around 160.00 during the European trading session. The pair wobbles as investors await the United States Nonfarm Payrolls data for May, which will be published at 12:30 GMT. Investors will closely monitor the employment data to get fresh cues regarding the Federal Reserve’s monetary policy outlook.

Gold remains offered below $4,500 following US Payrolls

Gold prices trade with a bearish bias and still remain below the key $4,500 mark per troy ounce at the end of the week. The slighlty softer tone in the US Dollar alongside mixed US Treasury yields across the curve also keep the yellow metal’s downside somewhat contained.


Cardano hits five-year low even as Hoskinson clarifies "break" isn't an exit

Cardano (ADA) price is down 10% at press time on Friday, extending losses over 30% so far this week amid Charles Hoskinson's clarification that "break" isn't an exit.

Week ahead – Fed countdown begins amid US inflation data and geopolitical risks

Fed Chair Warsh’s first meeting approaches as key US inflation data could reshape expectations. Oil prices remain elevated as US-Iran talks continue; tariffs also return to the spotlight. ECB is expected to hike; will it be a one-off move or is July live?

The US economy defies the rules: 100 days into the Oil shock and the recession signal is still missing

More than three months after the start of the Iran war and the resulting disruption to global energy markets, the US economy continues to display remarkable resilience. The conflict has triggered a sharp rise in Oil prices, reignited inflationary pressures and fueled widespread concerns about a potential economic slowdown.