Nvidia Stock Price and Forecast: Why NVDA stock is set to fall further
- Nvidia shares closed nearly 2% lower on Wednesday.
- NVDA has recovered from Omicron losses last week.
- NVDA is seeing profit-taking ahead of the year-end.

Nvidia shares did not participate in the tech-led continuation rally on Wednesday as the stock lost just under 2% and closed at $318.26. Record highs were set last week at $346.47 before Omicron fears hobbled the market. Nvidia had a very shaky day on Monday but recovered well to close just over $300. The stock had traded as low as $280 in what appeared to be some panic-led selling that had all the appearance of some stops being triggered. Tuesday was back to business as usual with an 8% gain, but momentum failed to materialize yesterday. This could signal more losses ahead. The stock is up hugely for 2021, 143% to be exact, so profit-taking is going to be a headwind until the year end in our view.
-637746461742607097.png)
Nvidia (NVDA) stock chart, 1-hour
Nvidia (NVDA) stock news
The proposed Arm Ltd. takeover by Nvidia has come under further scrutiny as it emerged that the Federal Trade Commission has filed a lawsuit against the deal. The Information reported yesterday that Nvidia had proposed to settle the deal, but the FTC rejected this. According to the exclusive article, "Nvidia proposed creating an independent company to license Arm’s designs and provide technical support to customers such as Apple, Google, Microsoft and Amazon. Nvidia would give control of the licensing company to new investors, according to three people with direct knowledge of the settlement offer, which hasn’t been previously reported."
Wall Street analysts are now putting the probability of the deal going through as highly unlikely, and that may be hitting sentiment as well as year-end profit-taking.
Nvidia (NVDA) stock forecast
The hammer candle from Monday is interesting. The bulls can argue the spike below $300 was swiftly rejected, but in order for this argument to be proven Nvidia needs to break to fresh record highs. Otherwise, bears will likely have another look lower to see if buyers are still there to defend the sub-$300 level. Nvidia needs to break $340 this week in our opinion to set up for more gains. Otherwise, $300 will be tested, and that will lead to a move to $267 pretty quickly if buyers fail to materialize. The Relative Strength Index (RSI) remains in a downtrend and has been signaling a bearish divergence. MACD has also crossed bearishly.
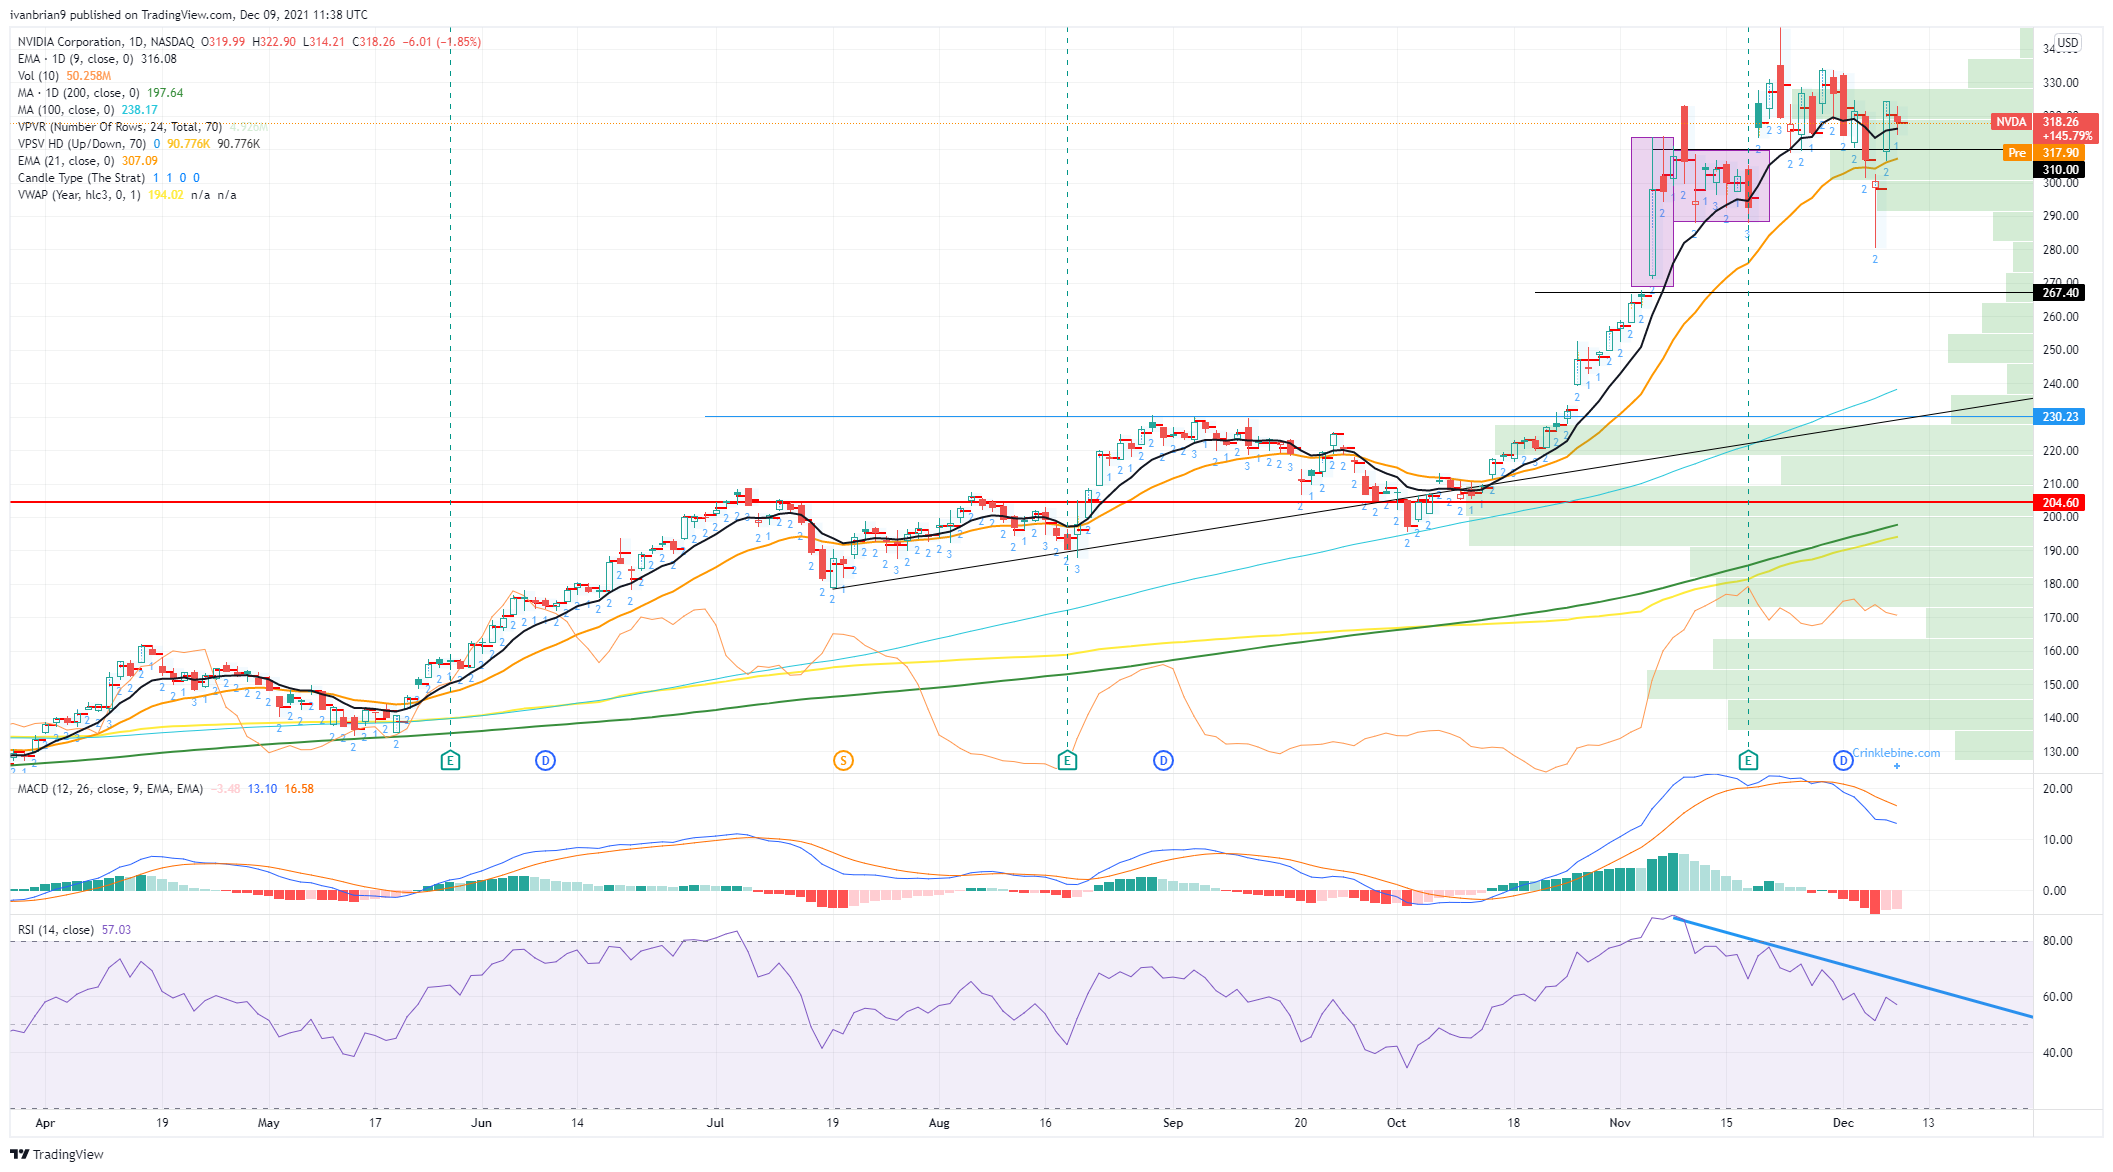
NVDA 1-day chart
Like this article? Help us with some feedback by answering this survey:
Author

Ivan Brian
FXStreet
Ivan Brian started his career with AIB Bank in corporate finance and then worked for seven years at Baxter. He started as a macro analyst before becoming Head of Research and then CFO.


![How Wall Street rigs the game [Video]](https://editorial.fxsstatic.com/images/i/market-chaos-01.jpg)














