NVIDIA Stock Price and Forecast: NVDA falls further as risk aversion dominates
- Nvidia (NVDA) stock retreats further on Friday as risk aversion dominates on Wall Street.
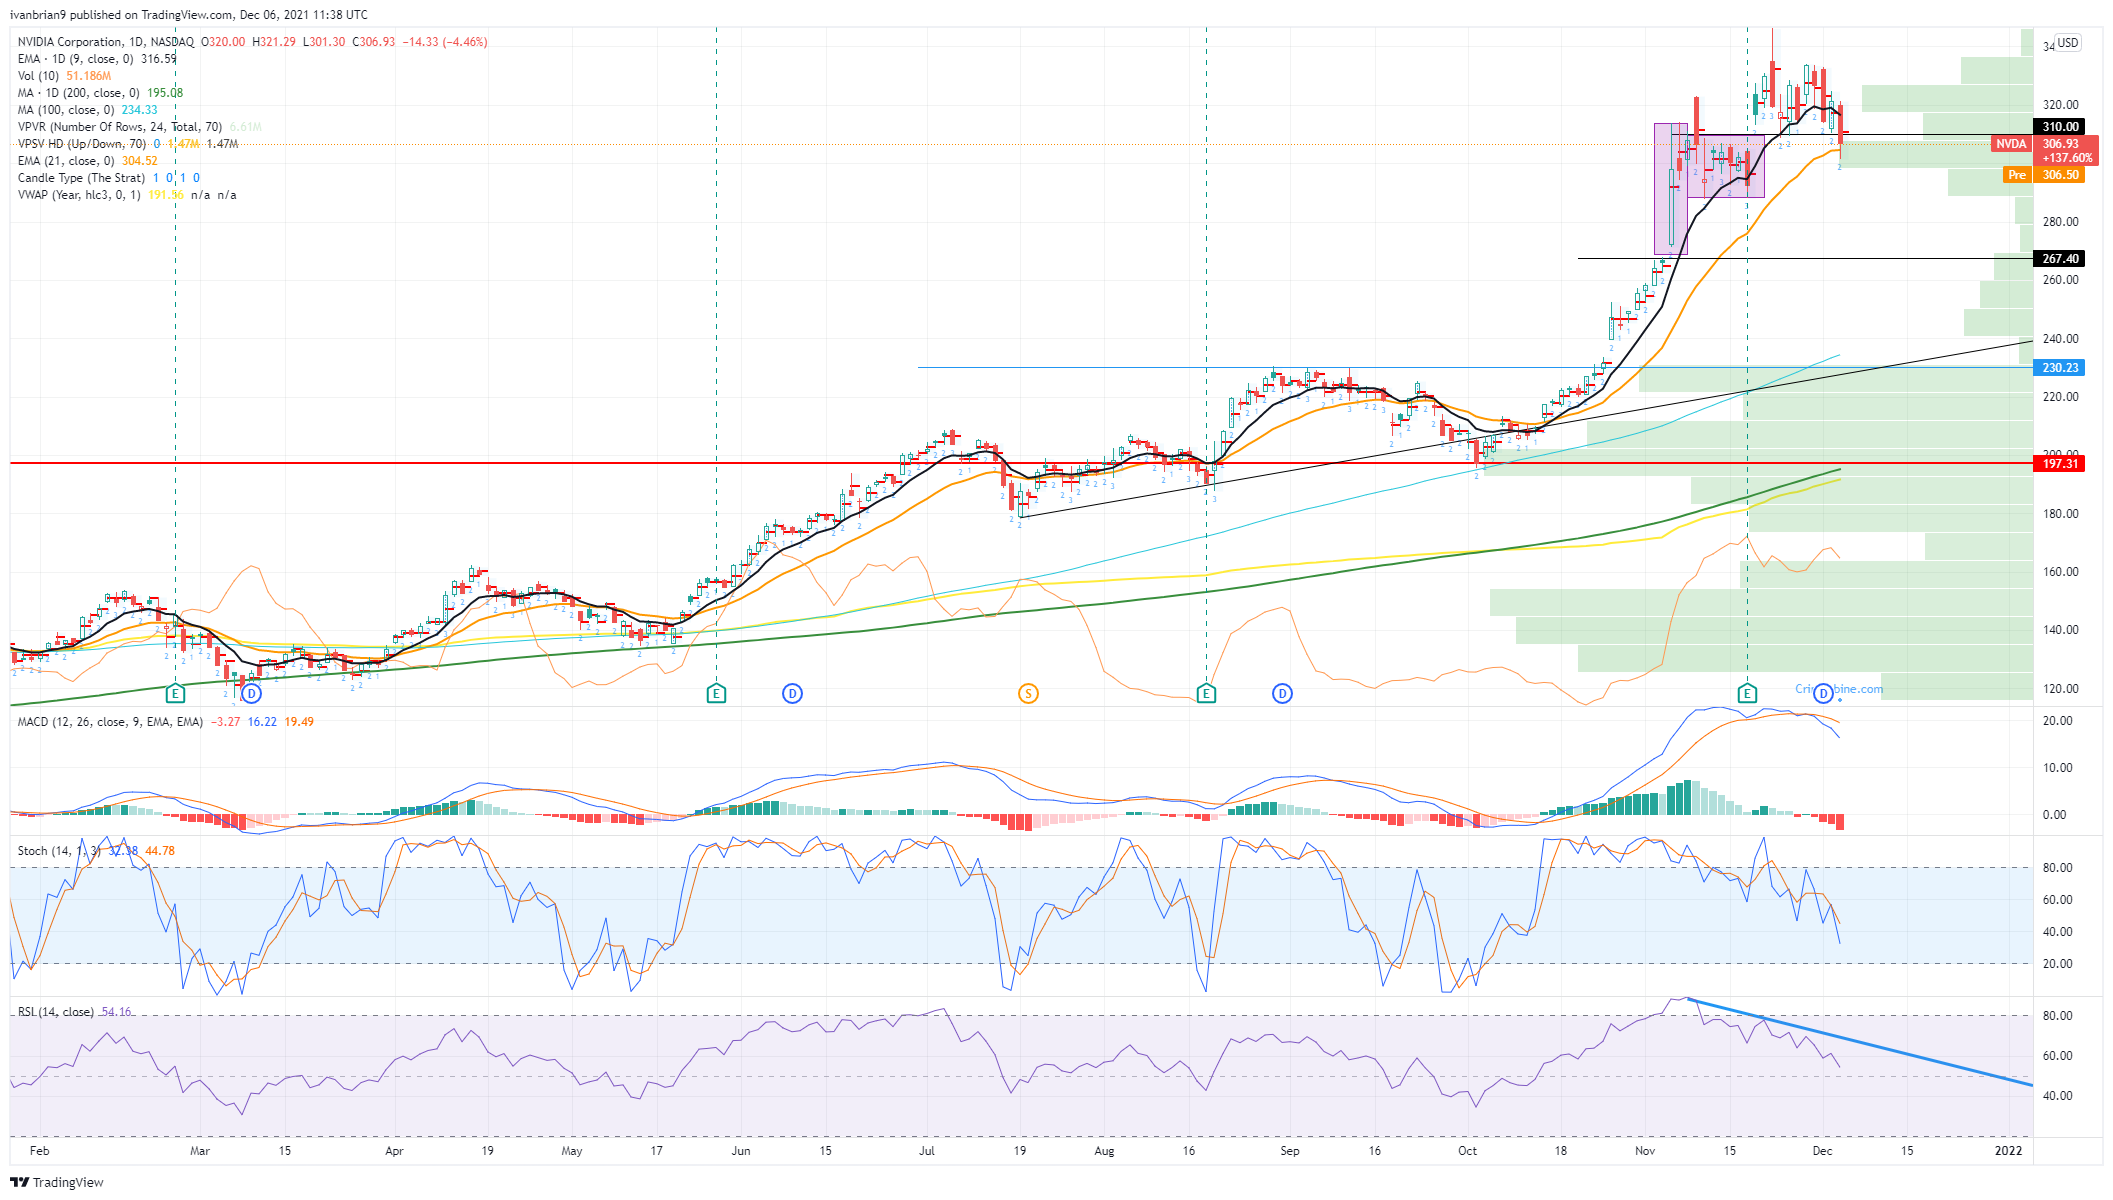
- NVDA stock falls over 4% and breaks the $310 pivot support level.
- NVDA stock is still up over 135% year to date.

Nvidia (NVDA) stock gave up more ground on Friday as risk aversion and profit-taking hit outperforming stocks harder. Seasonality is strongly bullish from here to year-end but profit-taking may hit the strong performers and limit gains. Nvidia and the semiconductor space have been one of the strongest sectors so far in 2021. Electric vehicle names also suffered heavy falls on Friday, again likely due to that sector's strong 2021.
-637743867121284081.png)
Nvidia stock performance 2021 in percentage terms, despite recent weakness this has been a stellar year for investors in Nvidia stock.
Nvidia (NVDA) stock news
The proposed purchase of ARM looks to be getting further and further out of reach as the Federal Trade Commission (FTC) in the US sues Nvidia. Reuters reports the suit is to "Prevent Chip Conglomerate From Stifling Innovation Pipeline For Next-Gen Technologies". The deal had been under intense scrutiny from regulators on both sides of the Atlantic. The UK had begun investigating the deal over national security concerns and the EU is also looking into the proposed deal. Reuters is reporting this morning that EU investigators are pausing their investigation into the deal. The European Commission is awaiting more information. In a related event, the potential delay or failure of the deal to go ahead has impacted on shares of SoftBank as they are the current owner of ARM. SoftBank shares fell by up to 9% on Monday in Tokyo.
Nvidia (NVDA) stock forecast
The mood has definitely changed here and Nvidia had become a momentum name like so many others this year. $310 was important as a short-term support as this was the low of the second breakout post the earnings report. Now that Nvidia has returned to the previous consolidation zone, the next support is the low of that at $289. Below that and it is then $267. We did have some clues that momentum was stalling. We can clearly see the bearish divergence from the relative strength index (RSI) as it did not make matching highs when Nvidia made a new record high on November 22. Since then Nvidia has been steadily falling. All three of our indicators are now bearish, the RSI, stochastics, and the MACD. $267 is the interim target unless the indicators change.
Author

Ivan Brian
FXStreet
Ivan Brian started his career with AIB Bank in corporate finance and then worked for seven years at Baxter. He started as a macro analyst before becoming Head of Research and then CFO.

















