Nvidia stock nears all-time high after Loop Capital hikes price target
- Loop Capital pushes NVDA price target from $175 to $250.
- $250 is now the high among Wall Street analysts for Nvidia stock.
- US equity indices are mixed on Wednesday following two days of strong advances.
- Nvidia stock has risen to within striking distance of the January 7 all-time high at $153.13.

Nvidia (NVDA) stock has risen more than 3% on Wednesday, just under its all-time high of $153.13 from January 7. The reason for euphoria is Loop Capital hiking its price target by 43% to a new high among Wall Street analysts.
Loop Capital's Ananda Baruah raised his price target on Nvidia from $175 to $250 on Wednesday. Baruah said that Nvidia's near monopoly of AI tech could garner it a $6 trillion market cap if annual factor AI and hyperscaler spending reach the $2 trillion figure in 2028 that Baruah expects.
The NASDAQ Composite leads the indices, up 0.45% at the time of writing. The S&P 500 is barely advancing, up 0.15%. While the Dow Jones Industrial Average (DJIA) sinks 0.11% despite holding Nvidia as one of its 30 constituents. Weakness among Verizon (VZ) and UnitedHealth Group (UNH) is holding it back.
JPMorgan put out a survey on Wednesday that should worry the market's bulls. The 2025 Business Leaders Outlook Pulse Survey shows that optimism on the US economy among US middle market executives has plummeted over the past six months from 65% to 32%. Additionally, their outlook on their local economies has dropped from 59% to 35%. Expectations of a recession in the US have risen from 14% to 32% among this same cohort.
Nvidia stock forecast
Nvidia stock is having trouble overcoming the $153.00 level at 11:00 am EST on Wednesday. If it does, then it will surely sail to a new all-time high above January 7's $153.13.
On Wednesday, NVDA broke above the long-term support range (green) from its two-year rally that it dropped out of in early March. Overcoming this obstacle means that NVDA has the ability to make a run for the top of the range near $190, but this will only happen if the macro and internal performance allow it.
Bulls will notice that the 50-day Simple Moving Average (SMA) is about to break above its 200-day counterpart, the Golden Cross pattern that typically foreshadows large reversal rallies.
However, the Relative Strength Index (RSI) nearing 72 shows that NVDA might need a period of consolidation before jetting higher. The area near the moving averages in the high $120s may suffice, but there is also critical short-term support in the $140s.
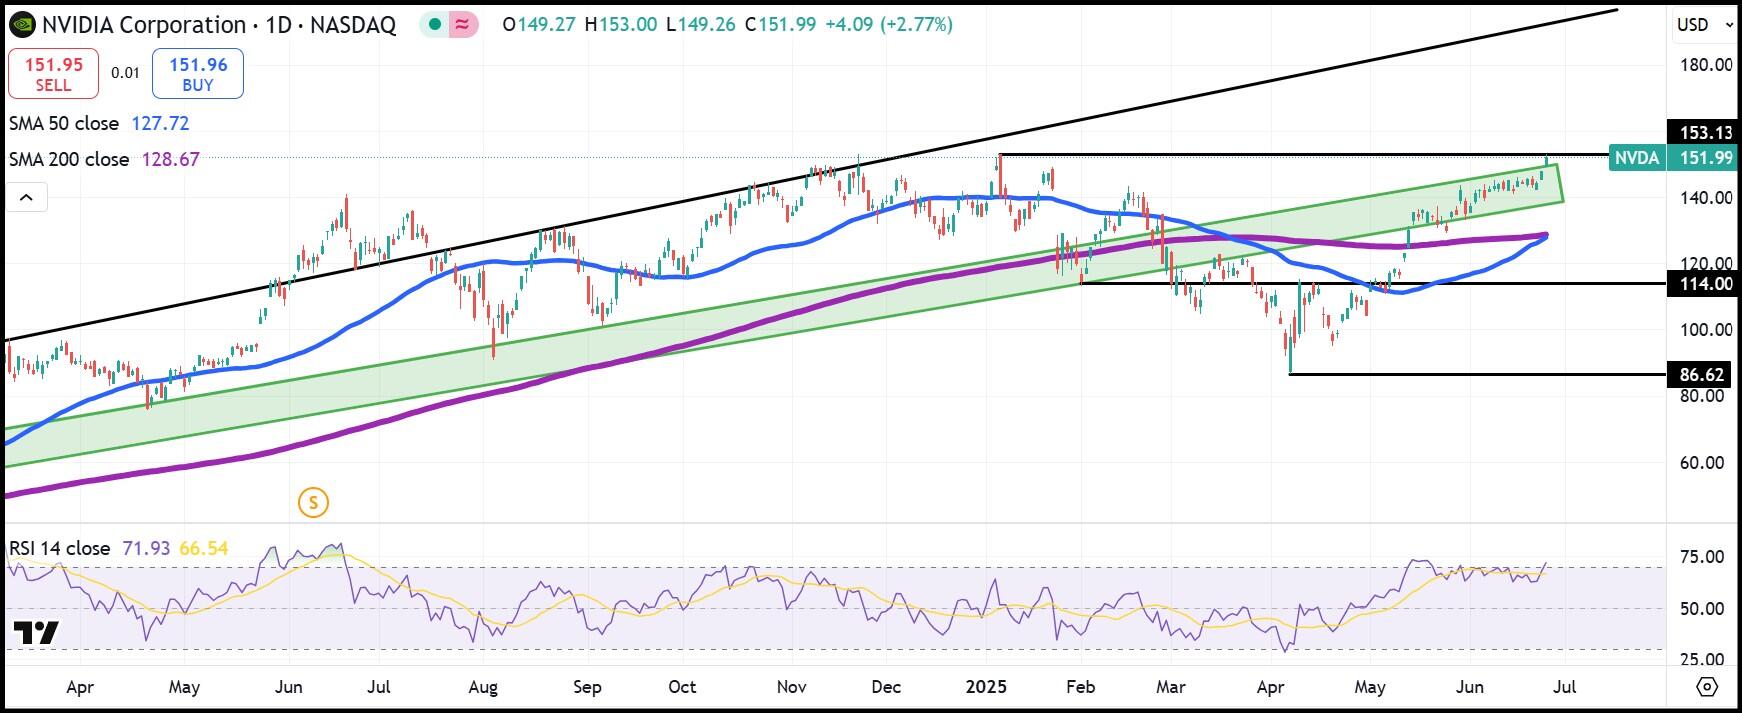
NVDA daily stock chart
Author

Clay Webster
FXStreet
Clay Webster grew up in the US outside Buffalo, New York and Lancaster, Pennsylvania. He began investing after college following the 2008 financial crisis.


