NVDA Elliott Wave technical analysis [Video]
![NVDA Elliott Wave technical analysis [Video]](https://editorial.fxsstatic.com/images/i/General-Stocks_3_XtraLarge.png)
NVDA Elliott Wave technical analysis
Function: Trend.
Mode: Impulsive.
Structure: Motive.
Position: Wave (iii).
Direction: Upside in (iii).
Deails: The current Elliott Wave count suggests NVIDIA is in wave (iii) of an impulsive structure. Prices are trading in the upper range of MinorGroup2 near $180. There is potential for further upside toward TradingLevel2 at $200 before wave (iii) peaks. Traders should remain alert to signs of a top forming, as the wave continues to stretch higher.

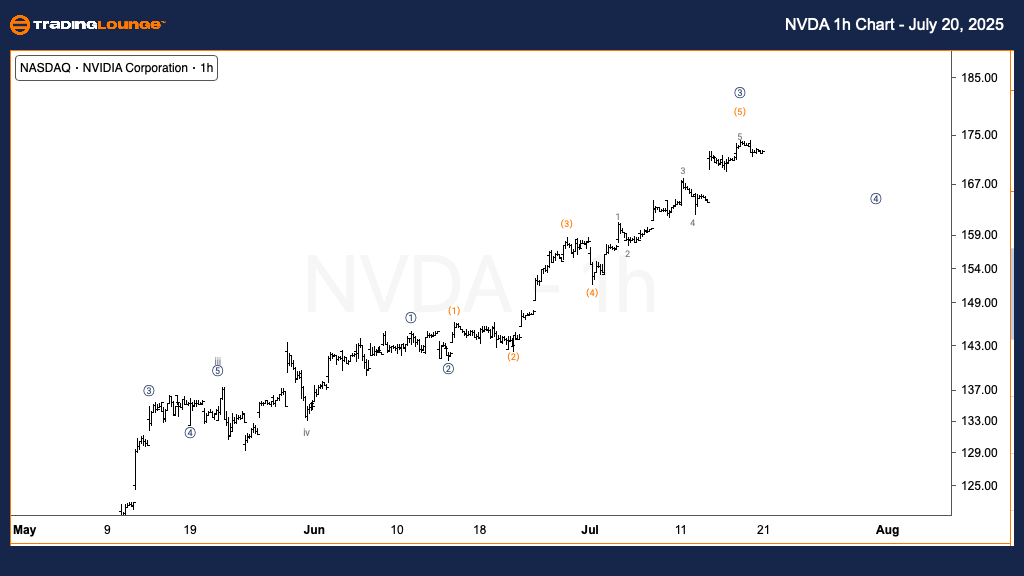
NVDA Elliott Wave technical analysis
Function: Trend.
Mode: Impulsive.
Structure: Motive.
Position: Microwave 3.
Direction: Top in Wave 3.
Details: On the 1-hour timeframe, NVDA is advancing through micro wave 3, nearing a possible end. The internal subdivisions suggest subminuette wave iv has completed, and a minor pullback in micro wave 4 could soon unfold. This would precede a final push higher in micro wave 5, which should complete the broader wave (iii). Watch for a brief consolidation followed by renewed upward movement as NVDA nears a resistance zone around $200.
This combined analysis provides a multi-timeframe view of NVIDIA Corp. (NVDA) using Elliott Wave Theory. It outlines both the medium-term and intraday structures, helping traders align their strategies with key wave milestones.
NVDA Elliott Wave technical analysis [Video]
Author

Peter Mathers
TradingLounge
Peter Mathers started actively trading in 1982. He began his career at Hoei and Shoin, a Japanese futures trading company.


