NVDA Elliott Wave technical analysis [Video]
![NVDA Elliott Wave technical analysis [Video]](https://editorial.fxstreet.com/images/Markets/Equities/Industries/Software/man-developing-software-637435356543561169.jpg)
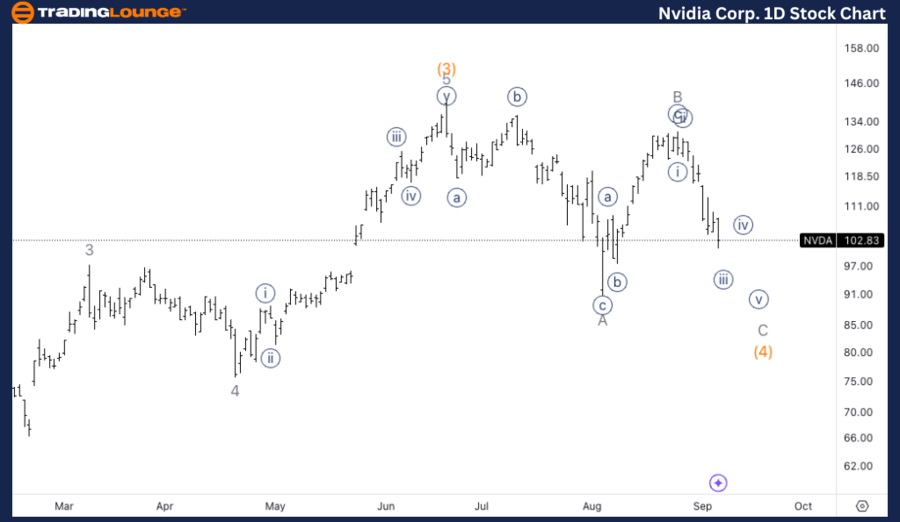
NVDA Elliott Wave Analysis Trading Lounge Daily Chart,
NVIDIA Corp., (NVDA) Daily Chart,
NVDA Elliott Wave technical analysis
Function: Counter trend.
Mode: Corrective.
Structure: Flat.
Position: Intermediate wave (4).
Direction: Downside in wave (4).
Details: At this point we are looking for a three wave move in wave (4), with equality of C vs. A as target at 84$.
NVDA Elliott Wave Analysis Trading Lounge 1H Chart,
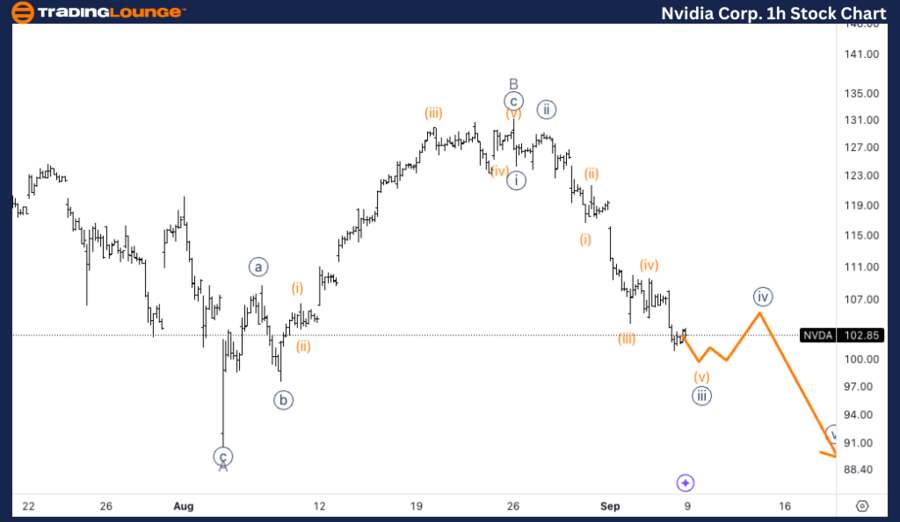
NVIDIA Corp., (NVDA) 1H Chart.
NVDA Elliott Wave technical analysis
Function: Countertrend.
Mode: Corrective.
Structure: Flat.
Position: Minor wave C.
Direction: Downside within wave C.
Details: Looking for further downside within wave C as we seem to be unfolding lower. We could expect a bounce in wave {iv} as we hit TL1 at 100$.
This analysis provides an Elliott Wave interpretation for NVIDIA Corp. (NVDA) based on both the daily and 1-hour charts. It outlines the current corrective trend and the key levels to watch as the stock navigates through a significant wave (4) correction.
NVDA Elliott Wave technical analysis – Daily chart
NVIDIA is in a corrective structure, likely a flat correction, unfolding as a three-wave move. Currently, the stock is moving lower within wave C, and the next target for wave (4) is set at 84$, where equality between wave C and wave A is expected. This suggests a deeper correction before the resumption of the long-term trend.
NVDA Elliott Wave technical analysis – One-hour chart
NVIDIA is currently progressing lower in wave C, and the next key support level is expected around 100$, near Trading Level1 (TL1). A bounce in wave {iv} of C could occur around this level before the final push lower to complete the correction. This would align with the structure's flat pattern, where wave C typically unfolds as a five-wave move.
Technical analyst: Alessio Barretta.
NVDA Elliott Wave technical analysis [Video]
Author

Peter Mathers
TradingLounge
Peter Mathers started actively trading in 1982. He began his career at Hoei and Shoin, a Japanese futures trading company.















