NVDA Elliott Wave technical analysis [Video]
![NVDA Elliott Wave technical analysis [Video]](https://editorial.fxstreet.com/images/Markets/Equities/Industries/CommunicationServices/communication-services-637435389701278979.jpg)
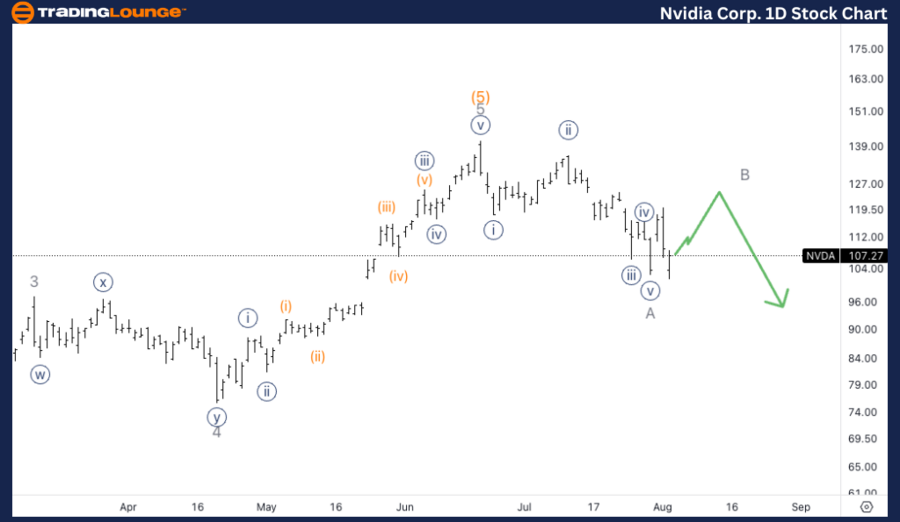
NVDA Elliott Wave Analysis Trading Lounge Daily Chart,
NVIDIA Corp., (NVDA) Daily Chart.
NVDA Elliott Wave technical analysis
Function: Counter Trend.
Mode: Corrective.
Structure: Zigzag.
Position: Intermediate wave (A).
Direction: Downside within wave (A).
Details: Looking for a top in wave (5), as we seem to have failed to find support on top of MG1 of 100$. Looking for a clear break and retest of TL1 at 100$ to have additional confidence in further downside developments for the longer term.
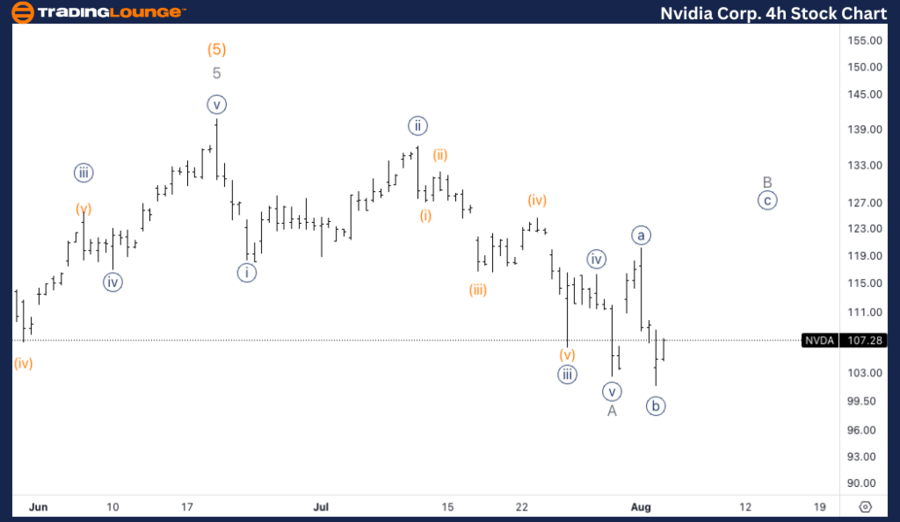
NVDA Elliott Wave Analysis Trading Lounge 4H Chart,
NVIDIA Corp., (NVDA) 4H Chart.
NVDA Elliott Wave technical analysis
Function: Counter trend.
Mode: Corrective.
Structure: Zigzag.
Position: Minor wave A.
Direction: Bounce in wave B.
Details: Here we are entertaining the possibility of a bounce in either wave B or 2 to then fall back lower, breaking the 100$ barrier.
Welcome to our latest Elliott Wave analysis for NVIDIA Corp. (NVDA) as of August 5, 2024. This analysis provides an in-depth look at NVDA's price movements using the Elliott Wave Theory, helping traders identify potential opportunities based on current trends and market structure. We will cover insights from both the daily and 4-hour charts to offer a comprehensive perspective on NVDA's market behavior.
NVDA Elliott Wave technical analysis – Daily chart
The analysis indicates that NVIDIA has likely reached a top in wave (5), failing to find support on top of the medium-grade level (MG1) at $100. This failure suggests further downside potential. A clear break and subsequent retest of the trendline (TL1) at $100 would provide additional confidence in the bearish outlook for the longer term.
NVDA Elliott Wave technical analysis – Four-hour chart
The shorter time frame suggests the possibility of a bounce within wave B or wave 2, which could provide a temporary relief rally before the continuation of the downward move. This bounce would precede a further decline, potentially breaking below the $100 barrier as the corrective phase progresses.
Technical analyst: Alessio Barretta.
NVDA Elliott Wave technical analysis [Video]
Author

Peter Mathers
TradingLounge
Peter Mathers started actively trading in 1982. He began his career at Hoei and Shoin, a Japanese futures trading company.


