|

NST Elliott Wave technical forecast [Video]

NST Elliott Wave technical forecast

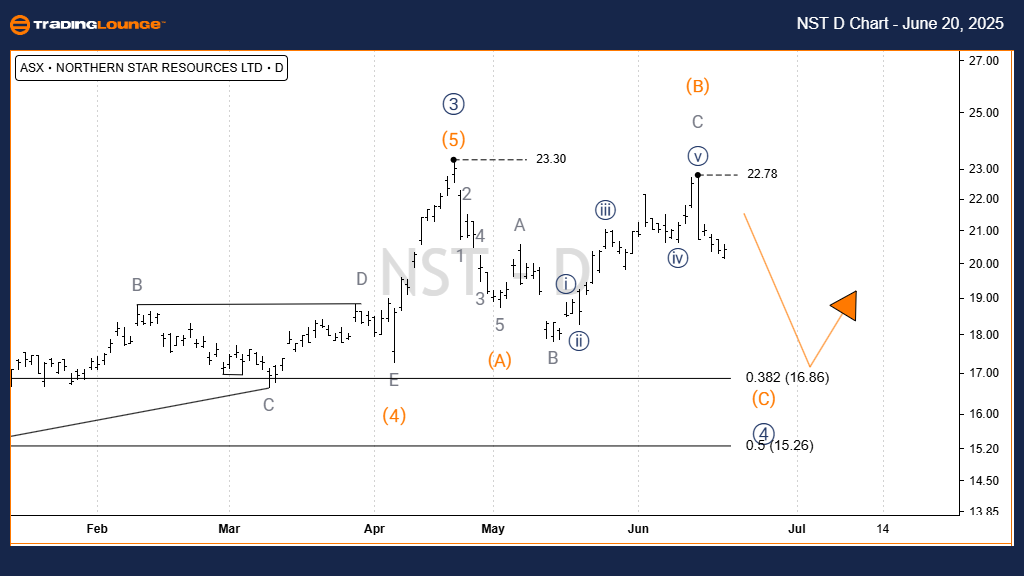
Greetings! Today’s Elliott Wave update focuses on the Australian Stock Exchange (ASX) ticker NST (Northern Star Resources Ltd). Our analysis suggests that ASX:NST is entering a bearish phase in the short term, with a projected drop toward around 16.86. There is no bullish bias at this time, and our wave count supports that outlook.

  • Function: Major trend (Minor degree, grey).

  • Mode: Motive.

  • Structure: Impulse.

  • Position: Wave C)‑orange of Wave 4))‑navy.

  • Details:

    • Wave 4))‑navy is unfolding lower as an ABC‑orange zigzag.

    • Waves A)B)‑orange have completed, and Wave C)‑orange is now heading downward toward a target of 16.86.

    • Invalidation point: 23.78.

  • Conclusion: No signs of bullish reversal—trend remains bearish.


Chart
  • Function: Major trend (Minor degree, grey).

  • Mode: Motive.

  • Structure: Impulse.

  • Position: Wave C)‑orange of Wave 4))‑navy.

  • Details:

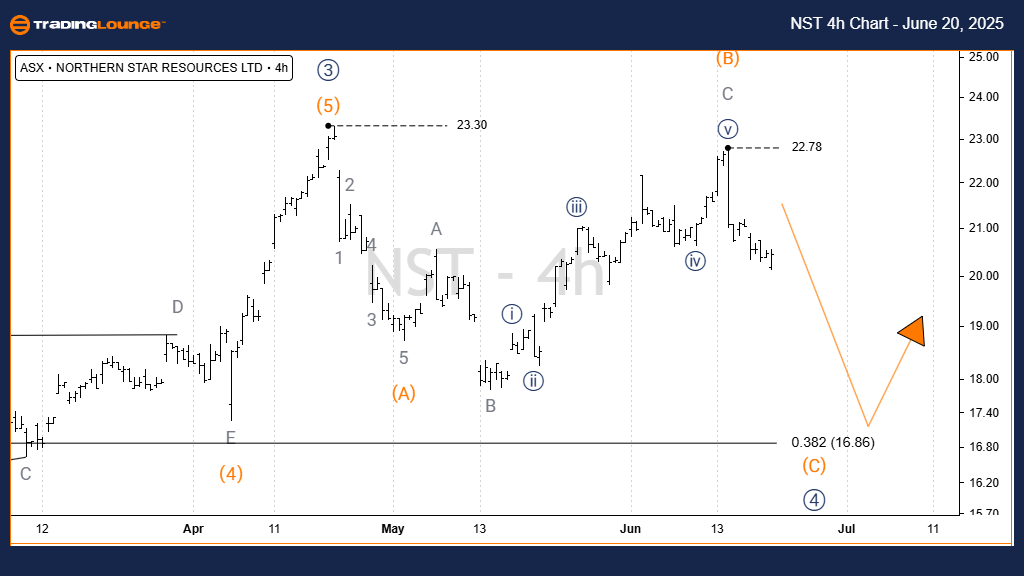
    • As seen on the 1D chart, Wave C)‑orange is unfolding downward post the high at 22.78.

    • Target remains near 16.86.

    • Invalidation point: 22.78.


Chart

Conclusion

Our structured forecast, based on Elliott Wave principles, outlines a clear short‑term bearish trajectory for ASX:NST. Key levels—16.86 as the target and 23.78 as the invalidation point—offer precise validation or invalidation markers. This enhances confidence and clarity in our outlook. The goal: providing readers with an objective, professional perspective on current market trends and actionable price signals.

NST Elliott Wave technical forecast [Video]

Author

Peter Mathers

Peter Mathers

TradingLounge

Peter Mathers started actively trading in 1982. He began his career at Hoei and Shoin, a Japanese futures trading company.

More from Peter Mathers
Share:

Editor's Picks

EUR/USD flat lines around 1.1900; looks to US NFP report for fresh directional impetus

The EUR/USD pair is seen oscillating in a narrow trading band around the 1.1900 mark during the Asian session on Wednesday as traders opt to wait for the release of US monthly employment details before placing fresh directional bets.

GBP/USD recovers losses despite rising UK political risks, BoE rate cut bets

Pound Sterling advances against the US Dollar after registering modest losses in the previous session, trading around 1.3650 during the Asian hours on Wednesday. The pair could extend losses as the Pound Sterling faces pressure from rising political risks in the UK and growing expectations of near-term Bank of England rate cuts.

Gold awaits US Nonfarm Payrolls data for a sustained upside

Gold remains capped below $5,100 early Wednesday, gathering pace for the US labor data. The US Dollar licks its wounds amid persistent Japanese Yen strength and potential downside risks to the US jobs report. Gold holds above $5,000 amid bullish daily RSI, with eyes on 61.8% Fibo resistance at $5,141.

Bitcoin, Ethereum and Ripple show no sign of recovery

Bitcoin, Ethereum, and Ripple show signs of cautious stabilization on Wednesday after failing to close above their key resistance levels earlier this week. BTC trades below $69,000, while ETH and XRP also encountered rejection near major resistance levels. With no immediate bullish catalyst, the top three cryptocurrencies continue to show no clear signs of a sustained recovery.

Dollar drops and stocks rally: The week of reckoning for US economic data

Following a sizeable move lower in US technology Stocks last week, we have witnessed a meaningful recovery unfold. The USD Index is in a concerning position; the monthly price continues to hold the south channel support.

XRP holds $1.40 amid ETF inflows and stable derivatives market

Ripple trades under pressure, with immediate support at $1.40 holding at the time of writing on Tuesday. A recovery attempt from last week’s sell-off to $1.12 stalled at $1.54 on Friday, leading to limited price action between the current support and the resistance.