|

Northern Star Resources Ltd – NST analysis and Elliott Wave technical forecast [Video]

ASX: NST Elliott Wave technical analysis

Today’s Elliott Wave update for the Australian Stock Exchange (ASX) focuses on NORTHERN STAR RESOURCES LTD – NST.

According to our analysis, ASX: NST appears to be entering a short-term bearish trend, potentially dropping to the 16.86 level. There are currently no signs of a bullish market based on this forecast.

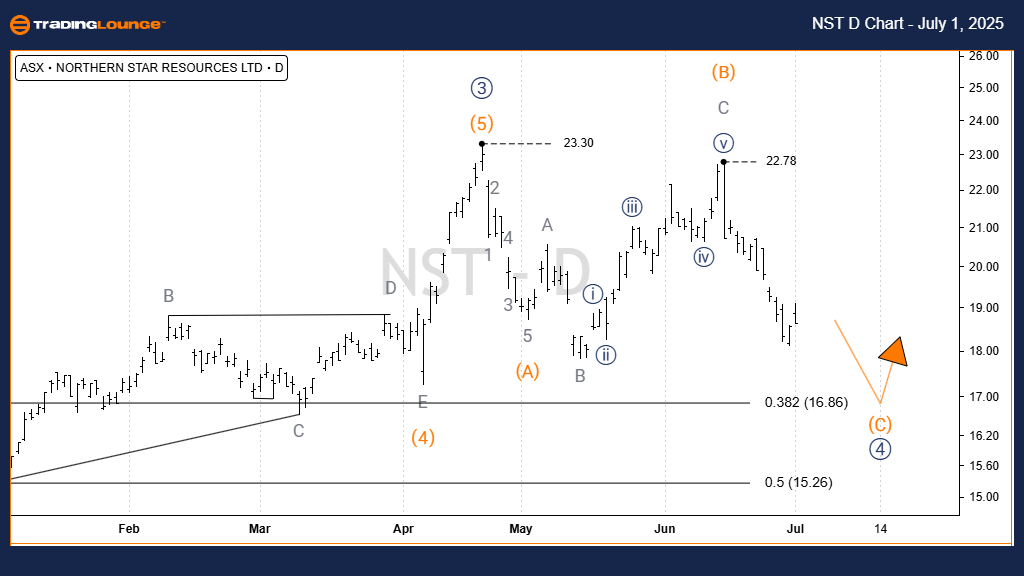
Elliott Wave technical analysis – One-day Chart (Semilog Scale)

  • Function: Major trend (Minor degree, grey).

  • Mode: Motive.

  • Structure: Impulse.

  • Position: Wave C) - orange of Wave 4)) - navy.

Details:

Wave 4)) - navy continues to decline, likely developing as an ABC-orange zigzag pattern. Wave A)B) - orange has completed, and since peaking at 22.78, Wave C) - orange is targeting 16.86. There is no bullish evidence currently.

  • Invalidation point: 23.78.
Chart

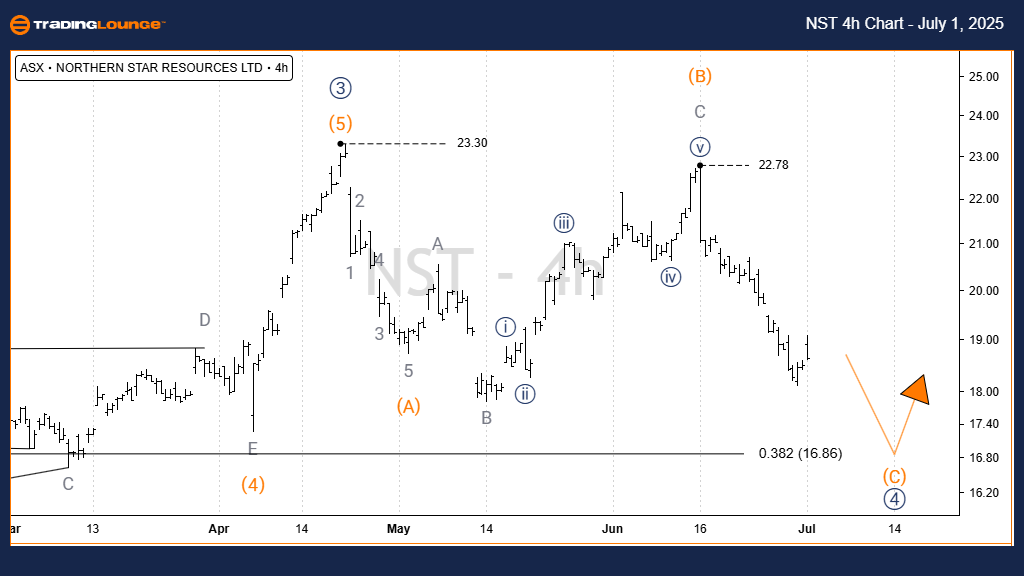
ASX: NST four-hour chart analysis

  •  Function: Major trend (Minor degree, grey).

  • Mode: Motive.

  • Structure: Impulse.

  • Position: Wave C) - orange of Wave 4)) - navy.

Details:

No new data beyond the 1D chart. Since the 22.78 peak, Wave C) - orange is continuing lower, eyeing 16.86 as a target.

  • Invalidation Point: 22.78.
Chart

Conclusion

Our forecast and technical evaluation for ASX: NST offer insights into the market’s current momentum. We outline precise price markers for validation and invalidation to strengthen the reliability of our Elliott Wave count. With a structured methodology, we aim to present the most objective and professional trading outlook.

NST analysis and Elliott Wave technical forecast [Video]

Author

Peter Mathers

Peter Mathers

TradingLounge

Peter Mathers started actively trading in 1982. He began his career at Hoei and Shoin, a Japanese futures trading company.

More from Peter Mathers
Share:

Editor's Picks

EUR/USD treads water above 1.1850 amid thin trading

EUR/USD stays defensive but holds 1.1850 amid quiet markets in the European hours on Monday.  The US Dollar is struggling for direction due to thin liquidity conditions as US markets are closed in observance of Presidents' Day. 

GBP/USD flat lines as traders await key UK and US macro data

GBP/USD kicks off a new week on a subdued note and oscillates in a narrow range near 1.365 in Monday's European trading. The mixed fundamental backdrop warrants some caution for aggressive traders as the market focus now shifts to this week's important releases from the UK and the US.

Gold sticks to intraday losses; lacks follow-through

Gold remains depressed through the early European session on Monday, though it has managed to rebound from the daily trough and currently trades around the $5,000 psychological mark. Moreover, a combination of supporting factors warrants some caution for aggressive bearish traders, and before positioning for deeper losses.

Bitcoin, Ethereum and Ripple consolidate within key ranges as selling pressure eases

Bitcoin and Ethereum prices have been trading sideways within key ranges following the massive correction. Meanwhile, XRP recovers slightly, breaking above the key resistance zone. The top three cryptocurrencies hint at a potential short-term recovery, with momentum indicators showing fading bearish signs.

Global inflation watch: Signs of cooling services inflation

Realized inflation landed close to expectations in January, as negative base effects weighed on the annual rates. Remaining sticky inflation is largely explained by services, while tariff-driven goods inflation remains limited even in the US.

Ripple Price Forecast: XRP potential bottom could be in sight

Ripple edges up above the intraday low of $1.35 at the time of writing on Friday amid mixed price actions across the crypto market. The remittance token failed to hold support at $1.40 the previous day, reflecting risk-off sentiment amid a decline in retail and institutional sentiment.