Northern Star Resources Ltd Elliott Wave technical forecast [Video]
![Northern Star Resources Ltd Elliott Wave technical forecast [Video]](https://editorial.fxstreet.com/images/Markets/Equities/FTSE/ftse-100-index-17327640_XtraLarge.jpg)
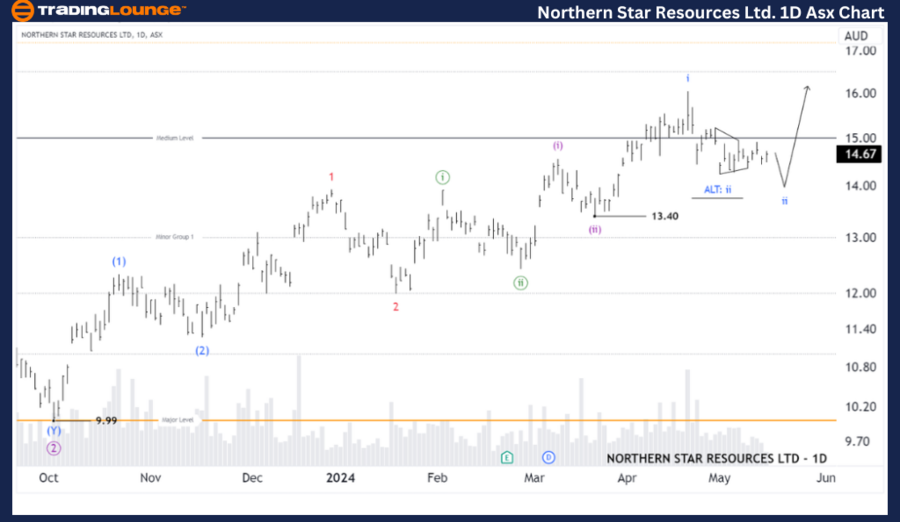
ASX: Northern Star Resources Ltd – NST Elliott Elliott Wave Technical Analysis TradingLounge (1D Chart)
Greetings, Our Elliott Wave analysis today updates the Australian Stock Exchange (ASX) with NORTHERN STAR RESOURCES LTD – NST. We identify the NST completing wave ii-blue before the third wave of the larger Degrees returns to push much higher.
ASX: Northern Star Resources Ltd – NST Elliott Wave technical analysis
Function: Major trend (Intermediate degree, blue).
Mode: Motive.
Structure: Impulse.
Position: Wave ii-blue of Wave (iii)-purple of Wave ((iii))-green of Wave 3-red of Wave (3)-blue.
Details: The short-term outlook indicates that the (iii)-purple wave is unfolding to push higher. Current price action shows that wave i,ii-blue is unfolding.
Invalidation point: 13.40.
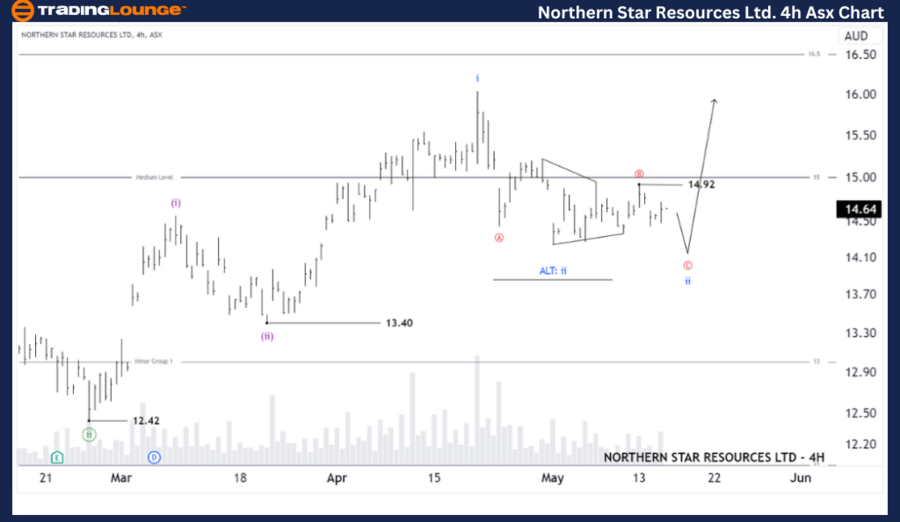
ASX: Northern Star Resources Ltd – NST four-hour chart analysis
Function: Major trend (Minuette degree, purple).
Mode: Motive.
Structure: Impulse.
Position: Wave ((c))-red of Wave ii-blue of Wave (iii)-purple.
Details: The shorter-term outlook shows that wave ii-blue is unfolding as an ABC-red correction, with wave ((b))-red appearing as a Triangle. Wave ((c))-red is unfolding to push lower. A rise above 14.92 will renew the view that wave ii-blue has ended and wave iii-blue will open to push higher.
Invalidation point: 13.40.
Conclusion
Our analysis, forecast of contextual trends, and short-term outlook for ASX: NORTHERN STAR RESOURCES LTD – NST aim to provide readers with insights into the current market trends and how to capitalize on them effectively. We offer specific price points that act as validation or invalidation signals for our wave count, enhancing the confidence in our perspective. By combining these factors, we strive to offer readers the most objective and professional perspective on market trends.
Northern Star Resources Ltd Elliott Wave technical forecast [Video]
Author

Peter Mathers
TradingLounge
Peter Mathers started actively trading in 1982. He began his career at Hoei and Shoin, a Japanese futures trading company.


