Nio Stock Forecast: NIO loses ground despite excellent July delivery results
- Nio trades around $15 on Tuesday.
- July deliveries reach 20,462, a 91% increase from June.
- Li Auto has bested all the other EV newcomers in China with two months in a row of 30,000+ deliveries.
- XPeng sees July deliveries drop 5% YoY, XPEV declines on news.

Nio (NIO) stock takes losses on Tuesday despite releasing quite successful data regarding deliveries for July. The Chinese electric vehicle (EV) purveyor delivered 20,462 vehicles to customers in July. This was more than double the figure one year ago.
The EV stock is trading around the $15.00 level during the US session.
Nio stock forecast: Li Auto deliveries overshadow Nio, XPeng
Nio’s delivery figures for July put to bed a poor prior showing in June when the company delivered just 10,707 units. July’s deliveries rose 91% MoM by comparison and nearly 104% from a year ago.
Still, it was no match for Li Auto (LI), whose July deliveries clobbered both Nio and EV competitor XPeng (XPEV). All three EV startups used to be in sync with around 10,000 deliveries a month apiece just one year ago. But for the second month in a row, Li Auto delivered more than 30,000 units.
Li Auto delivered 34,134 vehicles in July, most of which are hybrid vehicles rather than Nio and XPeng’s fully electric offerings. Li Auto is following in the footsteps of BYD (BYDDY), the top EV maker in China that heavily promotes its hybrid offerings. Li Auto’s delivery figure for July rose 228% YoY, while XPeng’s 11,008 deliveries actually fell 5% YoY although they increased 28% from June. XPeng shares dropped 4% in the premarket.
Nio’s July delivery figure is comprised of 14,066 SUVs and 6,396 sedans. The major piece of the puzzle leading to Nio’s MoM surge in deliveries was the debut of its revamped ES6 electric SUV.
On July 26, Volkswagen announced a $700 million investment in XPeng, which spurred a rally in Nio’s stock price.
EV stocks FAQs
What are electric vehicles?
Electric vehicles or EVs are automobiles that use rechargable batteries and electric motors to accelerate rather than internal combustion engines (ICEs). They have been around for more that 100 years, but battery technology research & development was meager for much of the 20th century. Lithium-ion battery technology became advanced enough to produce EVs at scale in the late 1990s and 2000s, and sales have been steadily increasing since then Tesla’s Roadster was unveiled in 2008. EVs are viewed as a means of reducing carbon emissions since battery electric vehicles (BEVs) themselves produce zero emissions. Other vehicles called plug-in hybrid electric vehicles (PHEVs) utilize both battery electric power and ICEs as a backup.
What is the market share held by EVs?
EVs are growing from a small base, but they rose from 9% of global new auto sales in 2021 to 14% of the total in 2022. This was a 65% YoY growth rate, and the industry delivered 10.2 million EVs worldwide in 2022. Projections show this number climbing above 16 million in 2023. Across the world, market shares differ greatly among nations. Nearly 88% of Norwegian new car sales in 2022 were EVs. On the other hand, the United States, where much of the modern innovation in EVs was forged, had less than 8% of new vehicle sales go to EVs in 2022. The largest EV market in the world, China, saw 30% of the market go to EVs that year.
Who is the father of the EV?
We know you’re thinking Elon Musk, but he’s probably more like the father of the mass-market, contemporary EV. All the way back in 1827, a Hungarian priest named Anyos Jedlik invented the electric motor and used it the following year to power a vehicle of sorts. French scientist Gaston Planté invented the lead-acid battery in 1859, and German engineer Andreas Flocken built the first true electric car for the public in 1888. EVs made up about 38% of all vehicles sold in the US around 1900. They began losing market share rapidly after 1910 when gasoline-powered vehicles grew much more affordable. They largely died off until new research programs in the 1990s led to gradual private sector investment in the 2000s.
Who are the biggest makers of electric vehicles?
China’s BYD is by far the largest manufacturer of EVs in the world. In 2022 it sold 1.8 million EVs and in the second half of the year made up 20% of the global market. The asterisk given to BYD is that the vast majority of these vehicles are hybrids. Tesla’s 12% market share is often treated as more significant than BYD, because it only sells BEVs and is the most famous EV brand in the world. Volkswagen, BMW and Wuling then round out the top five. As a new sector with heavy investment though, many startups have flooded the market. These include China’s Nio, Li Auto and Xpeng; a Swedish-Chinese manufacturer called Polestar; and Lucid and Rivian from the US.
Nio stock forecast
Nio stock easily made it through the thicket within the $13 range, and now bulls have their sights set on the $16s. That price level (from $16 to $17) has plenty of historical volume from the April through October of 2022 time period.
If $17 can be overcome, then the market will look to $22 as their next price target. That’s the resistance level from September 2022, right before the EV maker shed 50% over the following several months.
With a reading just shy of 84, the Relative Strength Index (RSI) is severely overbought, meaning that a consolidation period would make the most sense at this juncture. Support should be found in the area between $13 and $14.
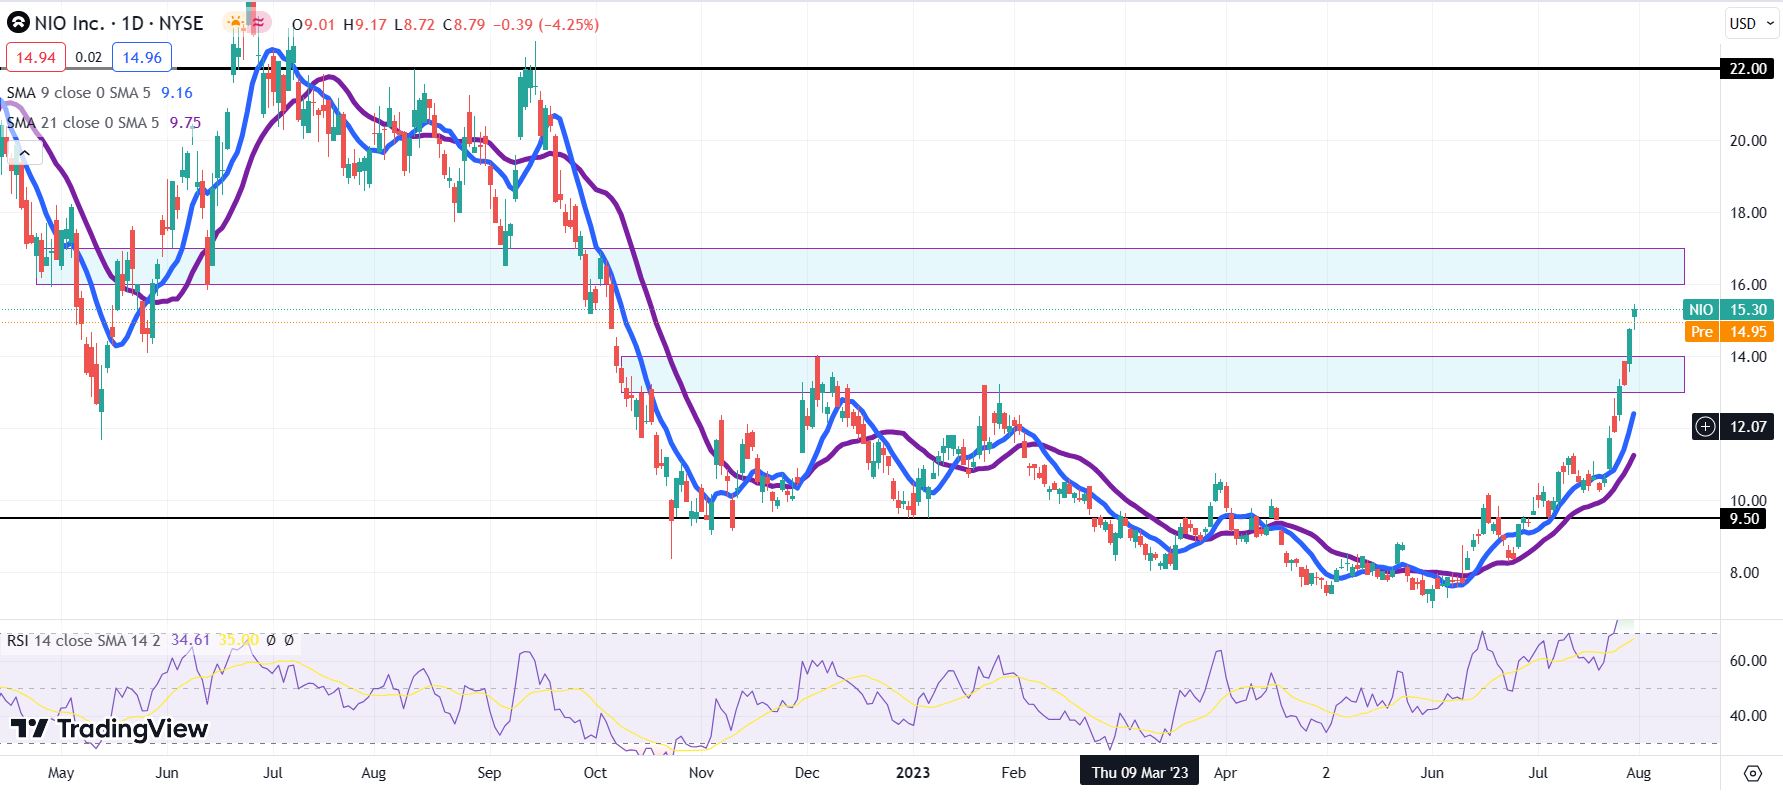
NIO daily chart
Author

Clay Webster
FXStreet
Clay Webster grew up in the US outside Buffalo, New York and Lancaster, Pennsylvania. He began investing after college following the 2008 financial crisis.


