|

Nikkei: Reaction lower from equal legs area

in this article we will see how the NIKKEI (JAPAN225) index has reacted lower from equal legs area. Here at Elliott Wave Forecast we have developed a system that allows us to define areas of the market in which buyers and seller agree to a reaction. These are high frequency areas in which gives us at least an 85% chance of a 3 waves reaction from these areas.

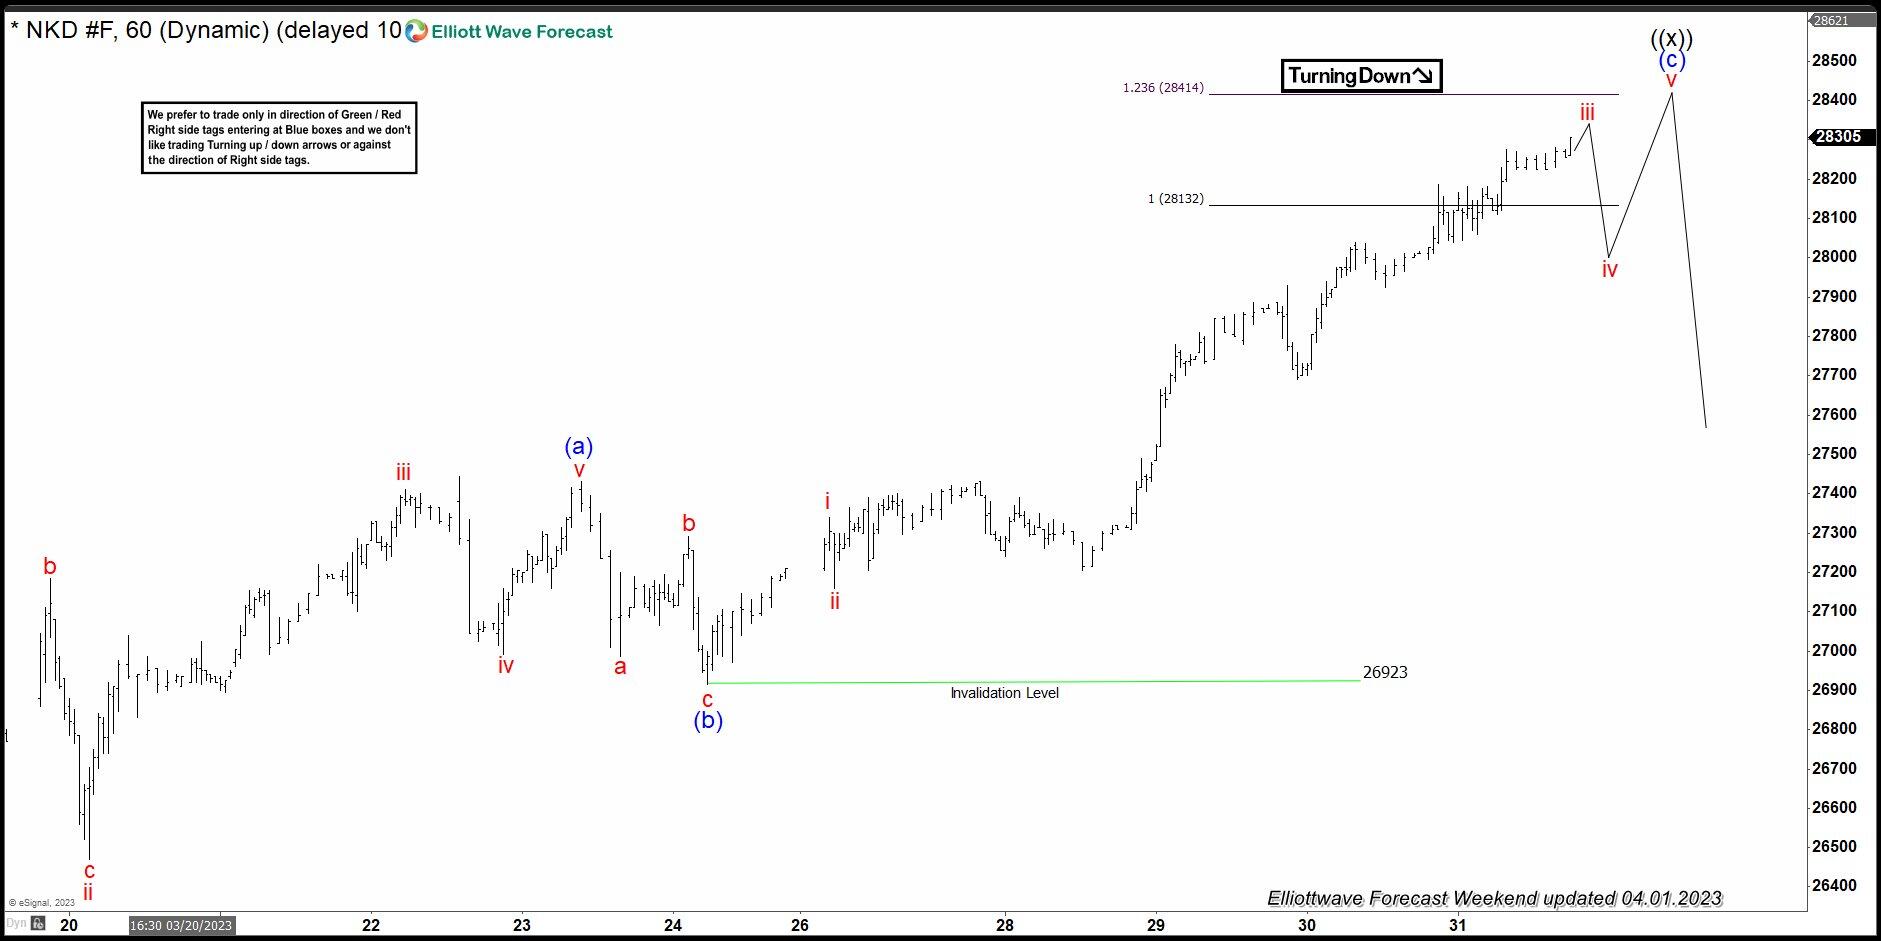
As soon as we can project an equal legs area we present it into our charts and our members know what they can expect. Nikkei has been trading within a 1 hour cycle from 03.15.2023 to complete its ((x)) leg higher. Consequently, having it’s first leg higher and connector within the corrective bounce we have presented the equal legs area. Let’s see the 1 hour update we presented to members from 04.01.2023 weekend update.

Nikkei 1 hour Weekend update 04.01.2023
NKD

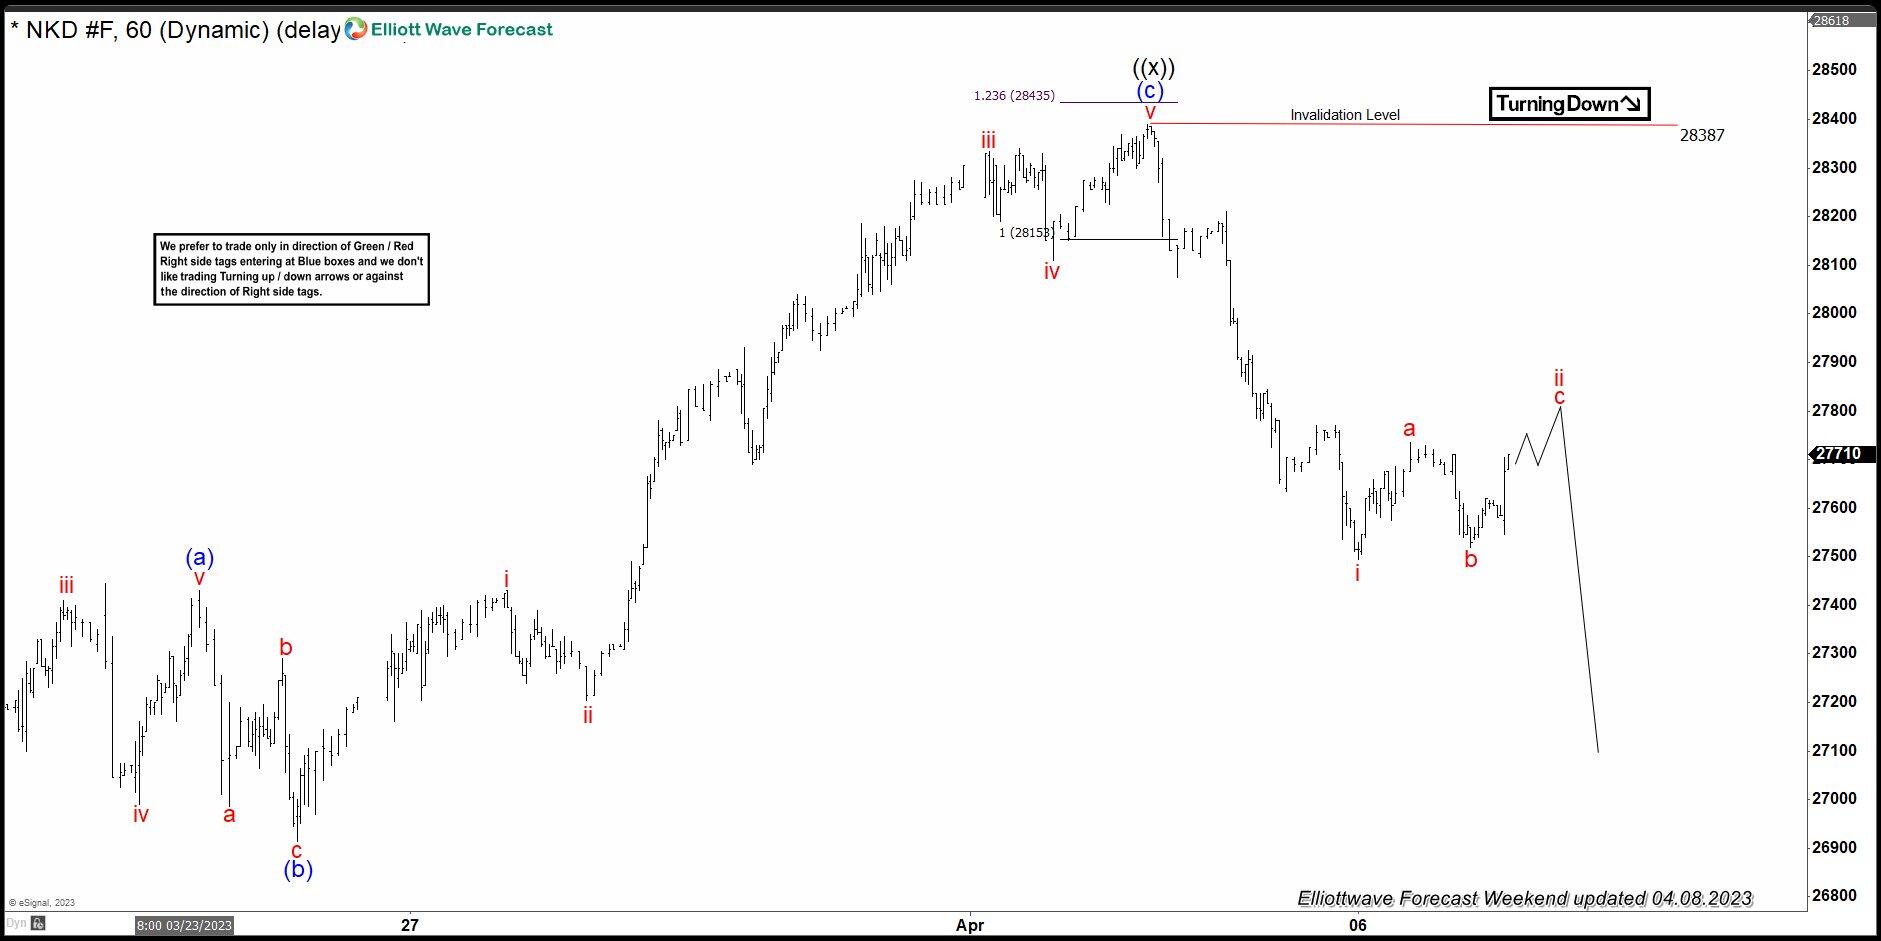
As we can see at that time we were within equal legs area of 28132 – 28414 area in which we were expecting a minimum of 3 waves reaction lower at least. Traders have a defined entry level with a defined Stop Loss at this point. As it is highly important to have a proper risk management system that allows you to enter and exit the market at all times. Next let’s have a look at the aftermath after the update. We will check the latest 1 hour weekend update from 04.08.2023.

Nikkei 1 Hour Weekend Update 04.08.2023
NKD

It has reacted lower as expected within wave i. Currently it is bouncing within wave c of ii and expected to fail below 28387 for wave iii lower. NIKKEI belong to our Group 1 instruments amongst other Indices such as the SPX, FTSE, DOW JONES.

Author

Elliott Wave Forecast Team

Elliott Wave Forecast Team

ElliottWave-Forecast.com

More from Elliott Wave Forecast Team
Share:

Editor's Picks

GBP/USD approaches May highs near 1.3650 on renewed USD selling

GBP/USD approaches the May high, while trading near 1.3650 in the European session on Thursday. The US Dollar slips again even as markets assess whether the US Treasury buyback will be a game-changer. Attention now remains on US data and Middle East headlines for further trading impetus.

EUR/USD hits fresh three-month highs above 1.1700

EUR/USD is at its highest level in three months, above 1.1700, in European trading on Thursday. The pair regains traction as the US Dollar resumes its downside, led by the US Treasury's bond buyback plan.. US Jobless Claims data are next in focus amid lingering Iran risks.

Gold stays in red below $4,500 despite resurgent USD supply

Gold sticks to modest intraday losses and remains below the $4,500 mark in the European session on Thursday. Despite geopolitical uncertainties, the US Dollar loses ground again, resuming the previous day’s slump to a three-month low.

Bitcoin extends gains above $71,000 as liquidity conditions improve

Bitcoin extends its gains, inching toward $72,000 on Thursday, as crypto markets continue to cheer the US Treasury’s decision to double its debt buyback operations. The move has sharply improved market sentiment and liquidity conditions, helped trigger a short squeeze, and overall provided a positive catalyst for the broader crypto market.

The bond coup
Yesterday was marked by a coup from the US Treasury, which suddenly announced that it will ‘at least double’ the maximum size of its buyback operations for longer-term debt, hoping to ease pressure on long-term yields and borrowing costs. Phoah! The markets reacted heavily to the news. The US 10-year yield fell sharply, while the 30-year yield dropped from its highest levels since 2007.
$20 billion offered, $2 billion taken: Why Treasury doubled its buyback cap

The US Treasury moved off its own calendar on Wednesday, and that is the part worth sitting with. At 12:32 GMT, the department said it would at least double the size of liquidity support buyback operations in the 10-year to 20-year and 20-year to 30-year sectors, lifting the maximum from $2 billion per operation to at least $4 billion, effective September 9 and running to November 4.















