|premium|

NIKKEI ($NKD_F) buying the dips at the blue box area

In this article we’re going to take a quick look at the Elliott Wave charts of NIKKEI published in members area of the website.  As our members know NIKKEI is showing impulsive bullish sequences that are calling for a further strength. Recently we got a 3 waves pull back that has ended right at the Blue Box zone (our buying area) .  In the further text we are going to explain the Elliott Wave Forecast and trading setup.

NIKKEI Elliott Wave 4 hour chart 07.11.2022

Chart

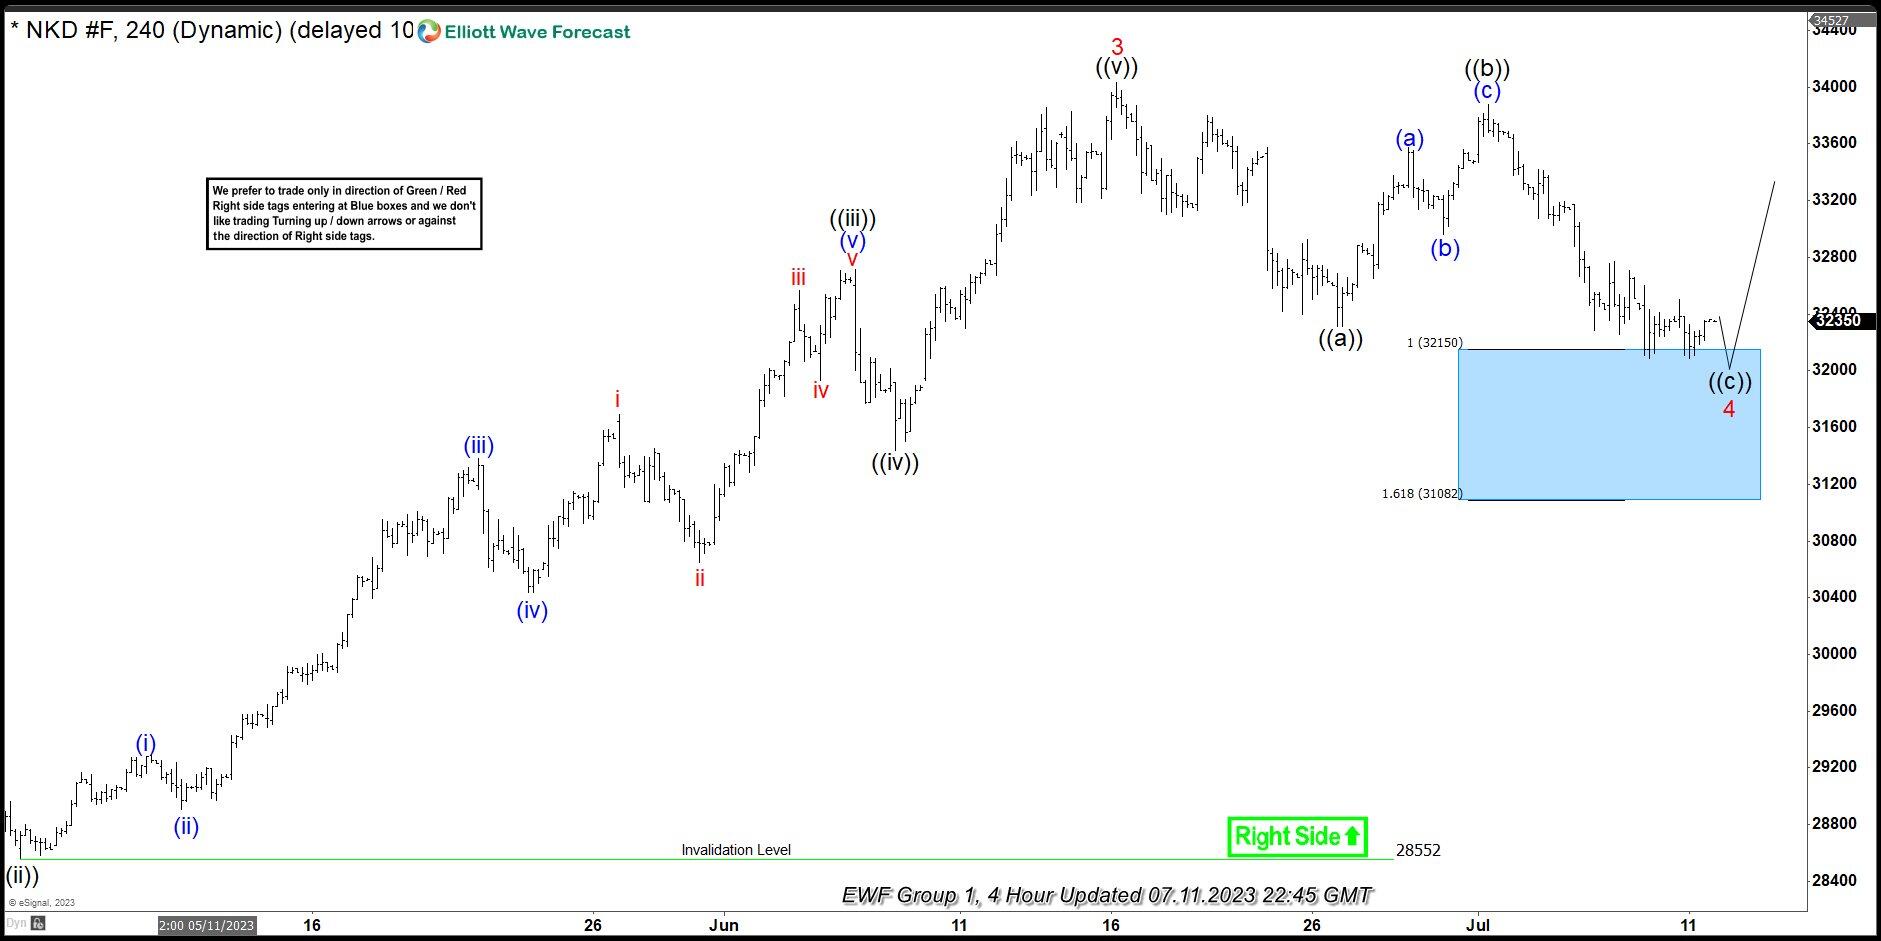
NIKKEI is giving  us pull back in 3 waves that are reaching extreme area at 32150-31082  blue box ( buying zone) .  We don’t recommend selling the futures and prefer the long side. NIKKEI should ideally make a rally toward new highs or 3 waves bounce alternatively. As our members know Blue boxes are based on 100% – 161.8%  Fibonacci extension area , that we trade in 3, 7, or 11 swing corrective sequence. Once bounce reaches 50 Fibs against the B red high , we will make long position risk free ( put SL at BE) and take partial profits. Invalidation for the long trades is break of 1.618 fib ext : 31082

Official trading strategy on How to trade 3, 7, or 11 swing and equal leg is explained in details in Educational Video, available for members viewing inside the membership area. Quick reminder on how to trade our charts :

Red bearish stamp+ blue box = Selling Setup
Green bullish stamp+ blue box = Buying Setup
Charts with Black stamps are not tradable. 

NIKKEI Elliott Wave 4 hour chart 07.19.2022

Chart

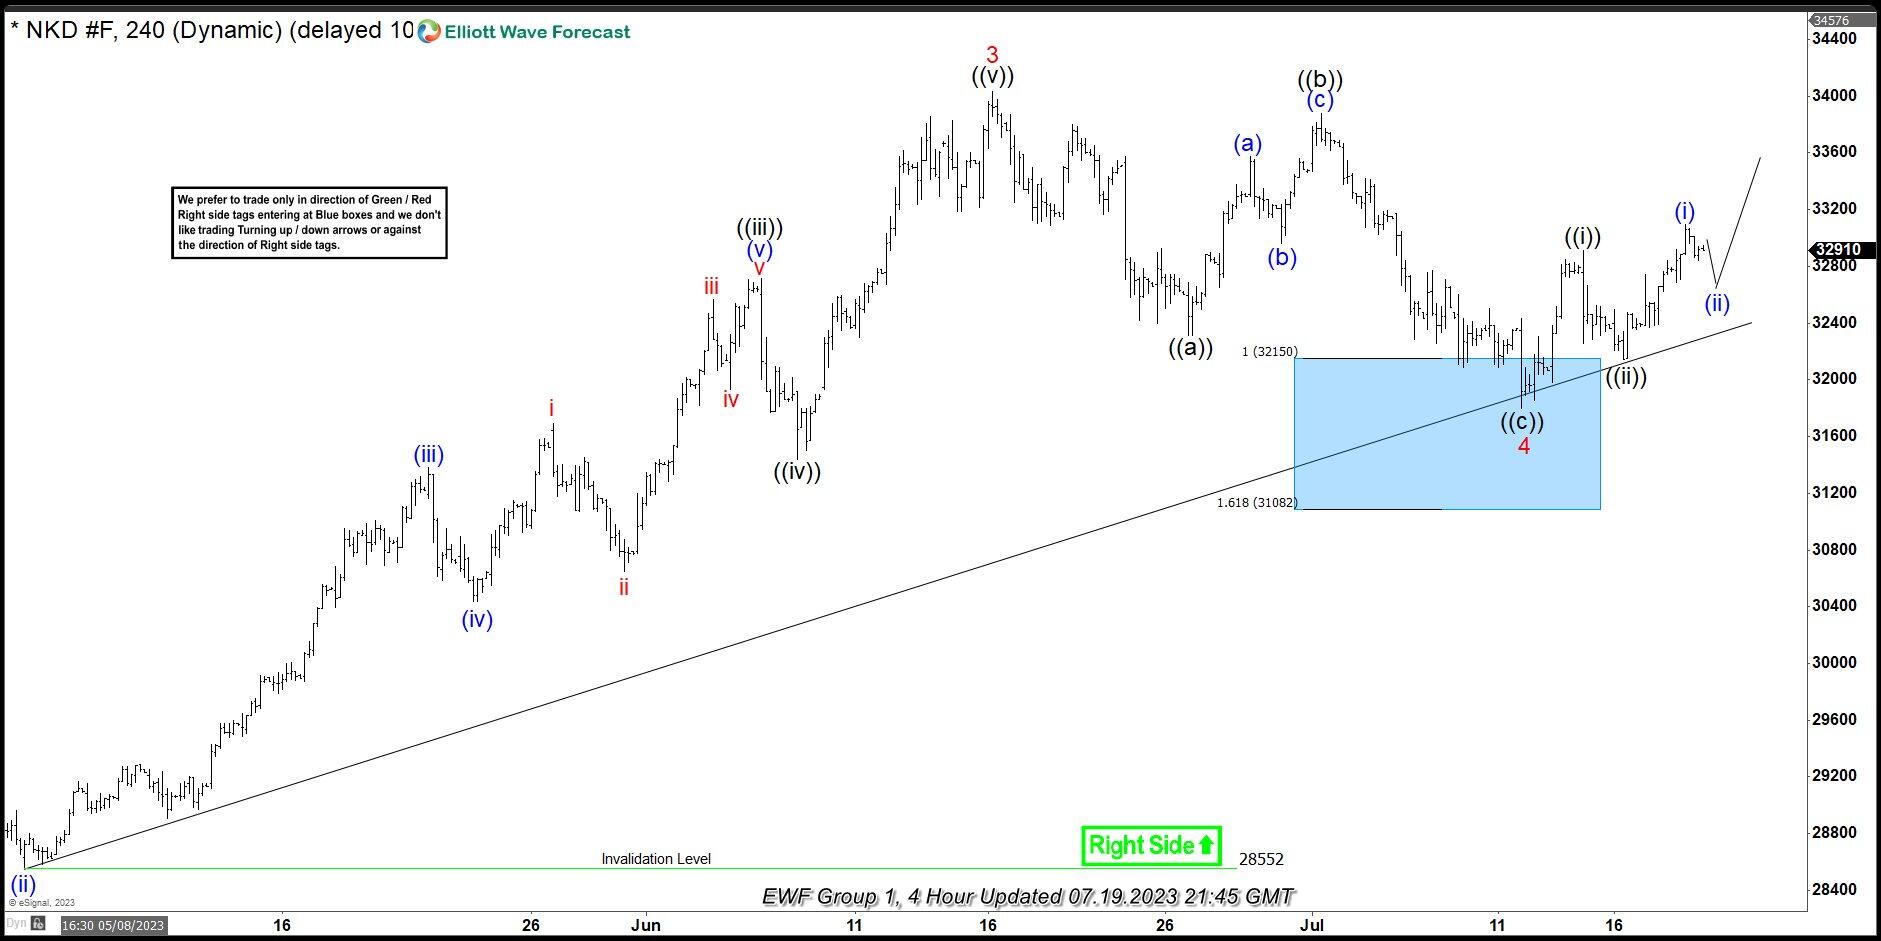
NIKKEI made good reaction from our buying zone. We call wave 4 red completed at 31811 low.  The price has reached and exceeded 50 fibs against the ((b)) black high. Members who took the long trade are enjoying profits now in a risk free positions. We would like to see break of  3 red high, to confirm next leg up is in progress.

Keep in mind that market is dynamic and presented view could have changed in the mean time.

Premium

You have reached your limit of 3 free articles for this month.

Start your subscription and get access to all our original articles.

Subscribe to PremiumSign In

Author

Elliott Wave Forecast Team

Elliott Wave Forecast Team

ElliottWave-Forecast.com

More from Elliott Wave Forecast Team
Share:

Editor's Picks

EUR/USD turns negative toward 1.1500 ahead of ECB rate decision

EUR/USD has come under fresh selling pressure and heads toward 1.1500 in Thursday's European trading. Rising bets that the European Central Bank will deliver a rate hike after its June policy meeting could limit the Euro's retreat amid renewed US Dollar demand. The focus now remains on the ECB's updated projections and Lagarde's words.

GBP/USD falls to 1.3350, as traders brace for US PPI data

GBP/USD is falling back to near 1.3350 in the European session on Thursday. Increased hawkish Fed bets and looming Mideast geopolitical risks sponsor the latest leg up in the US Dollar, as traders brace for the US PPI data.

Gold sticks to modest recovery gains near $4,100; looks to US PPI

Gold holds mild recovery gains near the $4,100 region, managing to hold above the lowest level since November 2025. A softer Core US Consumer Price Index eased concerns about a runaway inflation spiral, weighing on the US Dollar and prompting some intraday short-covering around the precious metal. All eyes are now on the US PPI report.

Pi Network: Recovery at risk with 16 million PI tokens ready for unlock

Pi Network edges higher after three days of consecutive losses earlier this week, extending the prevailing downtrend since late April. The scheduled unlocking of 16 million PI tokens on Thursday could add pressure to the intraday recovery. Technically, PI remains under bearish pressure.

European Central Bank set to hike interest rates for first time in nearly three years

The European Central Bank is set to announce its monetary policy decision at 12:15 GMT following its June meeting. The Frankfurt-based institution is widely expected to raise its key interest rates by 25 basis points, taking the deposit facility rate to 2.25% from 2%.

4.2% headline, 0.2% core: Why the Fed's next hike may be targeting the wrong problem

May's CPI put headline inflation at 4.2% on the year, up from 3.8% in April and the hottest reading since April 2023, while core prices rose just 0.2% on the month, undershooting the 0.3% consensus and halving April's pace.