|

Nikkei Futures (NKD) reach historic highs, extending bullish rally

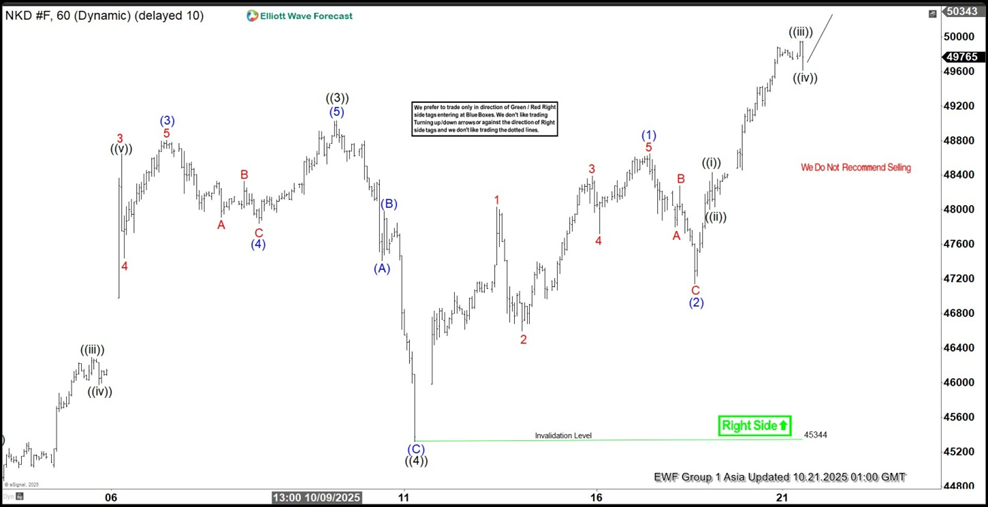
The short-term Elliott Wave analysis for Nikkei Futures (NKD) indicates a robust bullish trend, with the Index recently achieving a new all-time high. The rally to 49,030 marked the completion of wave ((3)), followed by a pullback to 45,344, which concluded wave ((4)). The internal structure of wave ((4)) developed as a zigzag Elliott Wave pattern. From the peak of wave ((3)), wave (A) declined to 47,410, followed by a wave (B) rally to 47,985. The Index then extended lower in wave (C), reaching 45,344, finalizing wave ((4)) in the larger degree.

The Index has since resumed its upward trajectory in wave ((5)). From the wave ((4)) low, wave 1 advanced to 48,030, with a subsequent wave 2 pullback concluding at 46,600. The Index then surged in wave 3 to 48,390, followed by a wave 4 dip to 47,720. The final leg, wave 5, reached 48,650, completing wave (1). A corrective wave (2) followed, ending at 47,145 in a zigzag structure. The Index has now resumed its ascent within wave (3). In the near term, as long as the pivot low at 45,344 holds, expect pullbacks to attract buyers in 3, 7, or 11 swings, supporting further upside in the Nikkei Futures.

Nikkei (NKD) latest one-hour Elliott Wave chart from 10.21.2025

Author

Elliott Wave Forecast Team

Elliott Wave Forecast Team

ElliottWave-Forecast.com

More from Elliott Wave Forecast Team
Share:

Markets move fast. We move first.

Orange Juice Newsletter brings you expert driven insights - not headlines. Every day on your inbox.

By subscribing you agree to our Terms and conditions.

Editor's Picks

EUR/USD: Bulls pray for a dovish Fed

EUR/USD has finally taken a breather after a pretty energetic climb. The pair broke above 1.1680 in the second half of the week, reaching its highest levels in around two months before running into some selling pressure. Even so, it has gained almost two cents from the late-November dip just below 1.1500 the figure.

GBP/USD trims gains, recedes toward 1.3320

GBP/USD is struggling to keep its daily advance, coming under fresh pressure and retreating to the 1.3320 zone following a mild bullish attempt in the Greenback. Even though US consumer sentiment surprised to the upside, the US Dollar isn’t getting much love, as traders are far more interested in what the Fed will say next week.

Gold: Bullish momentum fades despite broad USD weakness

After rising more than 3.5% in the previous week, Gold has entered a consolidation phase and fluctuated at around $4,200. The Federal Reserve’s interest rate decision and revised Summary of Economic Projections, also known as the dot plot, could trigger the next directional move in XAU/USD. 

Week ahead: Rate cut or market shock? The Fed decides

Fed rate cut widely expected; dot plot and overall meeting rhetoric also matter. Risk appetite is supported by Fed rate cut expectations; cryptos show signs of life. RBA, BoC and SNB also meet; chances of surprises are relatively low. Dollar weakness could linger; both the aussie and the yen best positioned to gain further. Gold and oil eye Ukraine-Russia developments; a peace deal remains elusive.

Week ahead – Rate cut or market shock? The Fed decides

Fed rate cut widely expected; dot plot and overall meeting rhetoric also matter. Risk appetite is supported by Fed rate cut expectations; cryptos show signs of life. RBA, BoC and SNB also meet; chances of surprises are relatively low.

Ripple faces persistent bear risks, shrugging off ETF inflows

Ripple is extending its decline for the second consecutive day, trading at $2.06 at the time of writing on Friday. Sentiment surrounding the cross-border remittance token continues to lag despite steady inflows into XRP spot ETFs.