Nikkei 225 (N225) Elliott Wave technical analysis [Video]
![Nikkei 225 (N225) Elliott Wave technical analysis [Video]](https://editorial.fxstreet.com/images/Markets/Equities/Nikkei/nikkei-225-index-17329557.jpg)
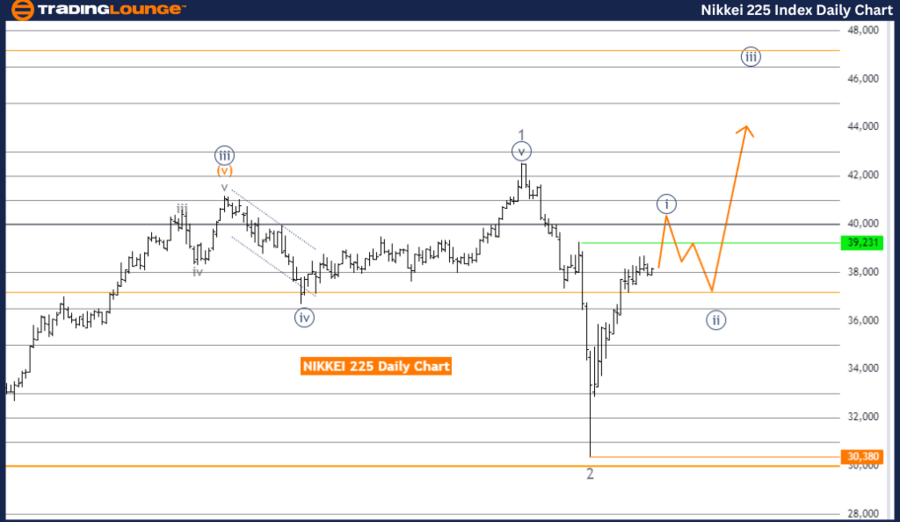
Nikkei 225 (N225) Elliott Wave technical analysis
Function: Bullish Trend.
Mode: Impulsive.
Structure: Navy Blue Wave 1.
Position: Gray Wave 3.
Direction next lower degrees: Navy Blue Wave 2.
Details: Gray wave 2 appears completed; now Navy Blue Wave 1 is active.
Wave cancel invalid level: 30,380.
The NIKKEI 225 is presently in a bullish trend according to the Elliott Wave analysis on the daily chart. The market is advancing in an impulsive mode, indicating a strong upward momentum. The main structure of interest is Navy Blue Wave 1, which marks the beginning of a larger upward movement. Within this structure, the market is currently in Gray Wave 3, suggesting that this phase of the trend is still in progress and has potential to move higher.
The analysis indicates that Gray Wave 2 seems to have concluded, meaning the market has finished a corrective phase and is now progressing into Navy Blue Wave 1. The completion of Gray Wave 2 sets the stage for the continuation of the bullish trend, with the expectation of further gains as Navy Blue Wave 1 unfolds. The direction for the next lower degrees points to Navy Blue Wave 2, which implies that after the current upward movement, a corrective phase might occur before the trend continues upward.
A crucial level to watch is 30,380, known as the Wave Cancel Invalid Level. This level is significant because if the price falls below it, the current wave structure would be invalidated, which could indicate a potential change in the market's direction or even a trend reversal. Traders should closely monitor this level to assess whether the bullish trend remains intact or if market dynamics are shifting.
In summary, the NIKKEI 225 is in a bullish impulsive trend on the daily chart, with the market positioned in Gray Wave 3 of Navy Blue Wave 1. The trend is expected to continue upward, but the 30,380 level is a critical point to observe, as a break below this level could invalidate the current wave structure and suggest a potential shift in the trend.
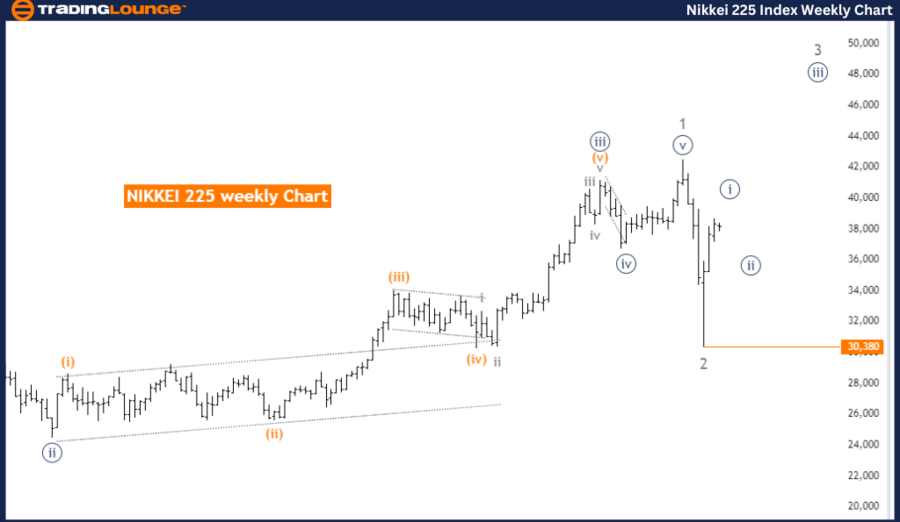
Nikkei 225 (N225) Elliott Wave technical analysis
Function: Bullish Trend.
Mode: Impulsive.
Structure: Navy Blue Wave 1.
Position: Gray Wave 3.
Direction next lower degrees: Navy Blue Wave 2.
Details: Gray wave 2 appears completed; now Navy Blue Wave 1 is active.
Wave cancel invalid level: 30,380
The NIKKEI 225 is presently in a bullish trend based on the Elliott Wave analysis on the weekly chart. The analysis reveals that the market is progressing in an impulsive mode, signifying strong upward momentum. The primary structure under observation is Navy Blue Wave 1, which marks the initiation of a significant upward movement within the broader trend. The market is currently positioned in Gray Wave 3, suggesting that this phase of the trend is still ongoing and has further potential to rise.
The analysis indicates that Gray Wave 2 seems to have concluded, signifying that the market has finished its corrective phase and is now advancing within Navy Blue Wave 1. This completion paves the way for continued upward movement as Navy Blue Wave 1 progresses. The direction for the next lower degrees points to Navy Blue Wave 2, which suggests that after the current upward movement, a corrective phase might occur before the trend resumes its upward trajectory.
A critical level to monitor is 30,380, referred to as the Wave Cancel Invalid Level. This level is significant because if the price drops below it, the current wave structure would be invalidated, potentially signaling a change in the market's direction or a trend reversal. Traders should closely observe this level to assess whether the bullish trend remains intact or if there are signs of a shift in market dynamics.
In summary, the NIKKEI 225 is in a bullish impulsive trend on the weekly chart, with the market positioned in Gray Wave 3 of Navy Blue Wave 1. The trend is expected to continue upward, but the 30,380 level is a crucial point to watch. A break below this level could invalidate the current wave structure, indicating a potential change in the market trend.
Nikkei 225 (N225) Elliott Wave technical analysis [Video]
Author

Peter Mathers
TradingLounge
Peter Mathers started actively trading in 1982. He began his career at Hoei and Shoin, a Japanese futures trading company.