|

Nike targets potential support at $35–$30 as selling pressure intensifies [Video]

Nike has been falling sharply over the past few months, making new lows and breaking below 2025 levels, which suggests the price may now be targeting levels not seen since 2016. Despite the ongoing decline, this could still be the late stage of a higher-degree wave C, potentially allowing for a more meaningful rebound toward the end of this year or early 2027. The latest gap down through base channel support suggests that the stock may now be in the final wave 5 of an impulse within wave C. Nike is approaching the $35–$30 area, which could provide potential support, but bulls would need to see an impulsive recovery toward $45 or higher to signal a potential temporary low.
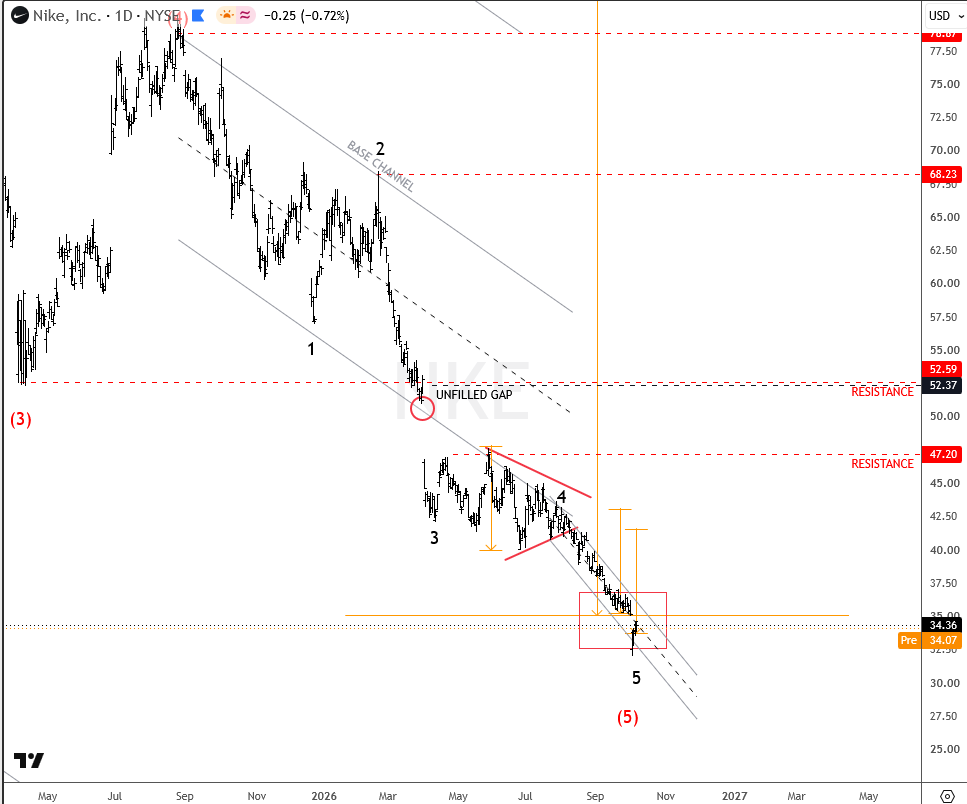
nikeD
NIKE Daily Chart

Highlights

  • Five waves down may be in their late stages.
  • Potential fifth-wave support zone around $35–$30.
  • Bullish confirmation requires an impulsive recovery toward $45 or higher.

For more analysis like this, you can watch below our latest recording of a live webinar streamed on October 12:
Youtube preview

Get Full Access To Our Premium Elliott Wave Analysis For 14 Days. Click here.

Author

Gregor Horvat

Gregor Horvat

Wavetraders

Experience Grega is based in Slovenia and has been in the Forex market since 2003.

More from Gregor Horvat
Share:

Editor's Picks

AUD/USD trims losses, still near 0.6900

AUD/USD remains well on the defensive, adding to Wednesday’s pullback and trading close to the key 0.6900 contention zone ahead of the opening bell in Asia. Discouraging prints from the Australian labour market report have weighed on the Aussie, which has remained unable to take advantage from the marked pullback in the Greenback.

USD/JPY slides back below 158.00 as USD reverses post-CPI gains

USD/JPY extends the previous day's pullback from a three-week high, attracting follow-through selling and sliding below 158.00 during Thursday's Asian session. Traders remain on high alert amid speculation that authorities will step in to prop up the Japanese Yen. The US Dollar, meanwhile, reverses Wednesday's hot CPI-led gains to April 2025 highs as US bond yields retreat on China bond-buying talk, further pressuring the pair.

Gold: Upside remains capped by $4,200

Gold regains the smile and leaves behind three consecutive days of losses, advancing to the $4,170 region per troy ounce on Thursday. The precious metal’s recovery comes amid the fresh offered stance in the Greenback and declining US Treasury yields while investors remain cautious ahead of the Fed’s Warsh speech on Friday.

Bitcoin rebounds to $82,000 as PPI hits 6.3%, nearly $1B liquidated
Bitcoin (BTC) recovered near $82,000 on Thursday after briefly falling below $80,000, paring losses triggered by hotter-than-expected US inflation data. September PPI inflation rose 6.3% YoY, exceeding forecasts of 5.3% and marking its second-highest level since November 2022. Core PPI inflation climbed to 5% annually, above expectations of 4.4%.
The Iran war will eventually end. Tariffs won't. Here's the problem
Two cost shocks are in the September Consumer Price Index (CPI), and they have different half-lives. Energy is up 20.4% on the year and accounts for about 1.3 points of the 3.7% headline, and that shock reverses when Oil does: Brent was back at its pre-war price on July 1 and above $100 again by the end of the month, after the ceasefire collapsed on July 8.
Everyone's dumping Gold after hot US inflation. Here's why $4,100 could be a floor, not a cliff
Gold (XAU/USD) is recovering from a sharp sell-off triggered by hotter-than-expected United States (US) inflation data released on Wednesday. The precious metal briefly plunged toward $4,073 as investors increased their bets on further Federal Reserve (Fed) interest rate hikes before recovering as US Treasury yields and the US Dollar (USD) reversed their initial gains.
















